I don’t know about you, but I love December. I like this month for a very specific reason. It’s not because it’s Christmas time and there is snow everywhere (while it’s still very cool to spend time with my family!) and it’s not because Star Wars IX arrives (well, maybe a little). It’s because December is the last month of the year.
I was discussing this topic with my best friend and business partner the other day. We both enjoy December because it gives us a framework that allows us to run comparisons. I know January 1st, 2020 will only be another date, just a date on a calendar. But, by dividing our year into 12 months, it gives us the opportunity to review what happened within that frame. Then, we can establish goals and make predictions for the coming 12 months and see how they turn out.
Many will try to tell you what is going to happen on the stock market in 2020. You might as well do a coin toss and get it right. Many will also tell you that stock markets are overvalued… as they keep saying since 2014. I’ve done some digging lately and realize a shocking truth; maybe stock markets aren’t overvalued.
Let’s discuss the elephant in the room…
The eternal question of valuation or “the market is overvalued right now”
Source: multpl.com
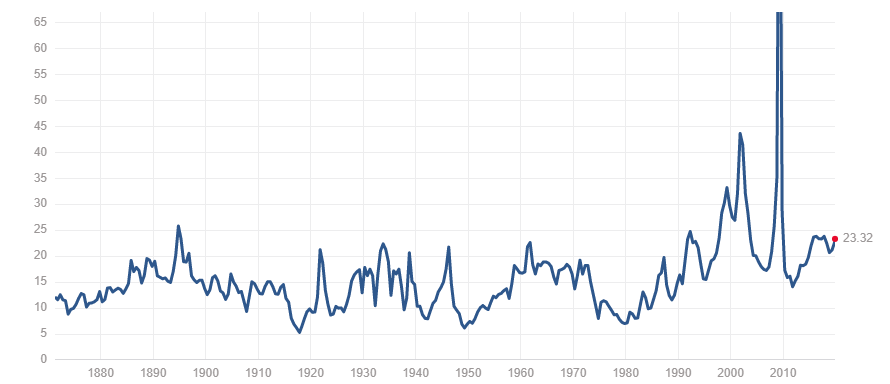
The graph above is the average price-earning (PE) ratio of the S&P 500. It is a very good indication of how much the market is willing to pay for the 500 largest companies according to their yearly profit. This graph was produced on the American Thanksgiving Day, November 28th. You can see the average PE ratio of 23.32. You will read in many articles that the average S&P 500 PE ratio since its inception has been ~15. We can deduct the market is “overvalued” by 55% (23.32 / 15). This is huge. Wait. It’s not that bad. I dug a little deeper and pulled the PE ratio on January 1st for the past 20 years. I wanted to include the tech bubble along with the financial crisis. Here’s my found:
Source: multpl.com
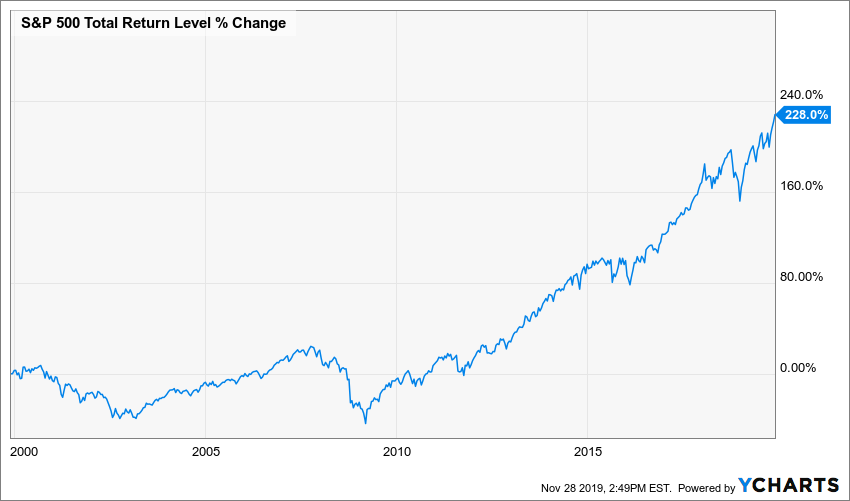
What I found is quite interesting, over the past 20 years, the average PE ratio on January 1st of each year (including November 27th data) is 25.38. If you want to play it geeky and go back to 1989, you will get an average of 23.35 over the past 30 years. In the past 20 years, the S&P 500 total return is 228%:
When you look at this graph, you will notice that between 2000 and 2010, the stock market generated virtually nothing. That’s a decade of profit lost for nothing. When we sit at the top of the mountain (this is a scary thought), what if we are about to hit another decade of… nothing?
When you compare the PE ratio of 1999 with today’s, you notice that things aren’t that bad. Back then, the valuation was up to nearly 33 times the S&P 500 earnings. Today, we are “only” at 23 which is lower than the average of the past 20 years and in line with the past 30 years. Maybe we should start thinking about a new frame of comparison. Maybe looking at the past 100 years isn’t the best model. Do you think today’s economic cycles are most likely to fluctuate as they did in the past 20 years or do you think it will look like 1940 again?
A new era for top stocks in the S&P 500
Also, the 5 largest companies in the S&P 500 are all tech stocks and they represent 15% of the total S&P 500 market cap. Besides Apple, they all show a PE ratio over 23.32:
- Alphabet (GOOG): 28.18
- Apple (AAPL): 22.60
- Microsoft (MSFT): 28.69
- Facebook (FB): 32.27
- Amazon (AMZN): 80.54
Please also note that none of those companies existed 50 years ago. Therefore, it becomes more obvious to give less weight to what happened 50+ years ago in our analysis of the stock market valuation. I’m asking the question again now:
Is the market really overvalued?
The answer isn’t that obvious anymore. As I wrote in my previous newsletter about investing with confidence, I don’t think you should focus on stock market valuation and the likelihood of a market crash. I think you should focus on the dividend payments you receive and make sure you don’t suffer a dividend cut. This will keep you focused on your investing strategy and you will ignore the noise and you won’t sell in panic.
If you can remember how you felt about the stock market exactly a year ago (remember, when the world was collapsing and most portfolios were down double-digits?), you will realize how fast tables turn these days.
How to invest in 2020?
I recently wrote an article on my other blog answering “What Should a Dividend Growth Investor Buy in 2020?”. At the end of the article, I explained that while many authors will predict what will happen in 2020, I really don’t know what’s coming. To be honest, I don’t really mind what will happen in 2020. What I know is that my portfolio will generate more dividends than it did in 2019 and 2018 and all the other years. I don’t buy stocks for 2020, I buy stocks for the next 20 years. The power of dividend growth will do the rest for me. Here are a few examples of companies that should be in your portfolio. Enter you name and email address and download some of my top picks for 2020:


Leave a Reply