One of the most important things to look for when it comes to investing in equities, and especially in dividend paying companies, is the shareholder yield.
The shareholder yield is a ratio that shows how much money the company is sending back to shareholders through a combination of dividends and share repurchases.
The dividend yield is one of the most widely reported metrics, but it doesn’t show the whole story. Companies that pay dividends are often spending a lot of money behind the scenes to buy back their own shares. Quite often, they spend even more on these buybacks than they do on dividends.
Companies can both issue new shares, and buy back existing shares, and are often doing both at the same time. Issuing shares often go towards employees and executives, whereas share buybacks are used in greater numbers to reduce the overall number of shares outstanding. The purpose of reducing the share count is to increase the ownership percentage of each share.
As an example, if there is a company that consists of 100 shares, then each share is worth 1% of the company. If the company uses cash from operations to buy back 10 of those shares and cancel them, then there are only 90 shares on the market, and so each share is worth 1.11% of the company. Reducing the share count can substantially accelerate EPS growth and dividend growth, but poorly timed buybacks can result in value-destruction by buying at bad prices.
How to Calculate Shareholder Yield
The easiest way to calculate the shareholder yield is to look at the most recent cash flow statement of the company. There are three values you need to look for.
1. Find the amount paid in dividends in total, and add to that the amount paid towards share repurchases.
2. Subtract the value of shares issued from this sum. The result is the total amount spent on dividends and net share repurchases.
3. Divide this total sum by the market capitalization of the company. This resulting percentage is the shareholder yield.
As an example, if a company spent $3 billion on dividends and $4 billion on share repurchases, but issued $1 billion worth of shares, then the total amount spent on dividends and net share repurchases was $6 billion. If the market capitalization of the company is $100 billion, then the shareholder yield is 6%.
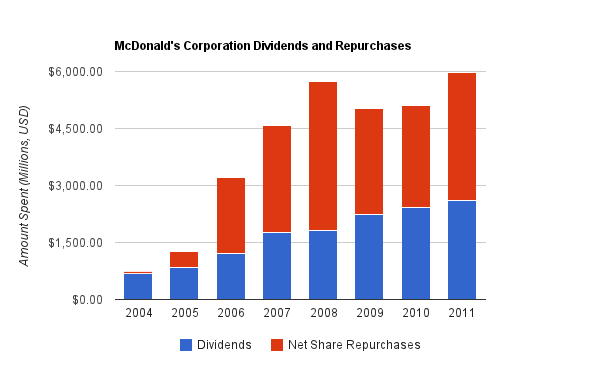
The following chart shows how much money McDonald’s spent on dividends and net share repurchases between 2004 and 2011.

As can be seen, the dividend was matched or exceeded by these buybacks in many years. In fact, McDonald’s decreased the number of shares outstanding by almost 20% over this time period.
When a company is both increasing the amount it pays in dividends and buying back stock to decrease the overall number of shares, the effects can be powerful for the shareholders, especially if they reinvest dividends. They’ll own a larger and larger portion of the company, and dramatically increase their dividend income streams.
Another good use of the shareholder yield is that it tells you approximately what rate of return you can expect if the company doesn’t grow at all and if the stock valuation remains static. The shareholder yield is an internal use of cash, so as long as the company maintains the status quo, they can keep growing the dividends and buying back shares. So, the shareholder yield is your baseline rate of return; any core growth is added onto that and results in the total return (along with changes in stock valuation).
Sign up for the free dividend and income investing newsletter to get market updates, attractively priced stock ideas, resources, investing tips, and exclusive investing strategies. Thousands of smart investors receive it each month:

