Oneok Inc. (OKE) is a natural gas utility company that owns the General Partner of Oneok Partners LP (OKS).
-Seven Year EPS Growth Rate: 4.1% 
-Seven Year Dividend Growth Rate: 12.6%
-Current Dividend Yield: 2.80%
-Balance Sheet Strength: Investment Grade
Overview
I published a stock report last week on Oneok Partners LP (NYSE: OKS), which is a relatively large natural gas and NGL master limited partnership. In the article, I stated that quantitatively and qualitatively, it appears to be a strong investment with a great combination of yield and growth.
Another way to invest in the assets of that partnership is to invest in Oneok Inc. (NYSE: OKE), which owns the General Partner, 100% Incentive Distribution Rights, and 41.4% of the Limited Partner units, of Oneok Partners LP. Unlike OKS which trades as an MLP, Oneok Inc. trades as a regular dividend stock. This article finishes the Oneok series by taking a look at this general partner.
Business Areas
Oneok Inc. is divided into three main areas: Distribution, Energy Services, and Oneok Partners.
Distribution
Oneok Inc. also owns three natural gas distribution companies that serve customers in Oklahoma, Kansas, and Texas. Oneok has been in business as an intrastate natural gas distributor in Oklahoma for over 100 years, and now serves three states with over 2 million customers. Oneok’s businesses in Oklahoma and Kansas are the largest in those states, while their Texas distributor is the third largest distributor in Texas.
Energy Services
Oneok makes contracts for supply, transportation, and storage of natural gas to customers across the U.S. This includes leases for storage and transport.
Oneok Partners
Oneok Partners is responsible for most of the growth of Oneok Inc. This MLP is described in more detail here, and primarily deals with natural gas pipelines and NGLs.
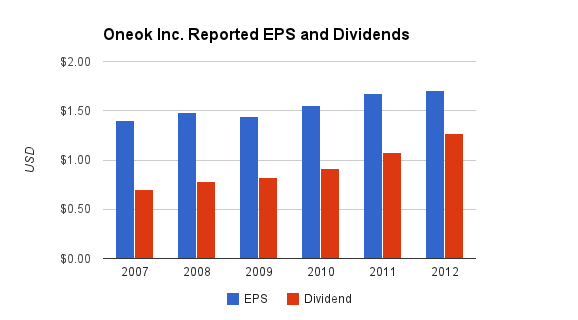
Earnings and Dividends

(Chart Source: DividendMonk.com)
For MLPs, earnings per share is not the most accurate way to express profitability of the business due to the very asset-heavy nature of the business. Oneok Inc.’s income statement includes the Oneok Partners income items and then accounts for non-controlling interests. As such, depreciation reductions are substantial for the business and result in a lower net income. A more important chart for profitability appears below in the Thesis section.
For dividends, the company currently pays a 2.8% yield and has an average five-year dividend growth rate of 12.6% per year. The company also buys back a small portion of its shares each year to reduce the outstanding share count ($150 million worth in 2012), and in 2012 purchased additional limited partner units of Oneok Partners LP to increase their total holding.
Approximate historical dividend yield at beginning of each year:
| Year | Yield |
|---|---|
| Current | 2.8% |
| 2012 | 3.0% |
| 2011 | 2.6% |
| 2010 | 3.5% |
| 2009 | 5.2% |
| 2008 | 3.2% |
| 2007 | 3.0% |
Balance Sheet
Oneok’s credit rating is BBB/Baa2. As the bulk of the assets for the business are in the MLP, this constitutes a fine credit rating and overall balance sheet strength. As very asset-heavy businesses, energy partnerships utilize substantial leverage in order to get solid returns on capital.
Investment Thesis
Oneok was a run-of-the-mill utility until the years between 2004 and 2006 when it purchased the general partner of Northern Border Partners and renamed it under the Oneok brand. Since then, the company has grown like wildfire because it has been able to use limited partner capital to produce an enormous internal rate of return thanks to the Incentive Distribution Rights (IDRs). The company is vertically integrated now, as the interstate pipeline assets that it acquired overlap geographically with their intrastate distribution assets.
Much like Kinder Morgan Inc. and Energy Transfer Equity, Oneok Inc. is a publicly traded general partner of another publicly traded partnership (Oneok Partners LP), and the overall benefits are similar.
Put frankly, a general partner holding of a well-run MLP can be one of the highest-returning investment structures there is, because the whole structure is based on allowing the general partner to get a share of the limited partners’ investment capital, while being given a good incentive to pay the limited partners ever-growing distributions.
The structure of an MLP is that there exists a general partner and limited partners. In the beginning, the general partner gets 2% of the distributions while the limited partners get the other 98%. But as the partnership hits higher per-unit distribution thresholds, the general partner gets a larger share of the distributions, which are called Incentive Distribution Rights (IDRs). So the general partner is given a strong incentive to raise the distribution for the limited partners, and over time if they are able to do so, their own rewards are even better, because they get a larger share of the total.
For Oneok, the distribution thresholds are as follows:
-Once OKS hits $0.3025 in distributions per unit per quarter, the general partner gets 15% of amounts distributed above that.
-Once OKS hits $0.3575 in distributions per unit per quarter, the general partner gets 25% of the amounts distributed above that.
-Once OKS hits $0.4675 in distributions per unit per quarter, the general partner gets 50% of the amounts distributed above that.
OKS is currently paying $0.715 in distributions per unit per quarter, so it’s well over the top threshold. As it continues to raise the distribution, the general partner (held by Oneok Inc., OKE) will continue to get this top tier chunk of the cash flows.
This is in addition to the fact that Oneok Inc. holds 41.4% of the limited partner units of OKS, so they also get those limited partner distributions.
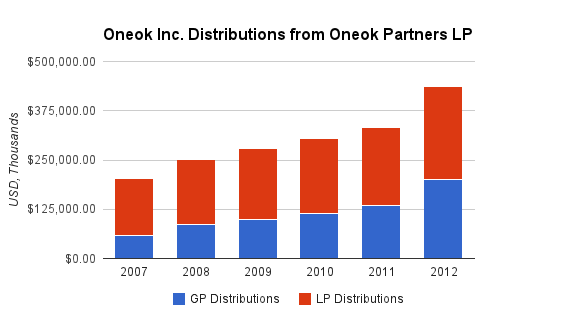
Here’s the chart that shows the distributions that Oneok Inc. (OKE) is receiving from Oneok Partners LP (OKS). The period is for 2007-2012, and shows the total broken down into the general partner share and the limited partner share.

(Chart Source: DividendMonk.com)
As can be seen, the general partner portion has grown much more quickly than the limited partner portion. The 2013 estimate for total distributions from Oneok Partners to Oneok Inc. by company management is expected to be another 25% higher than 2012.
In 2007 Oneok Inc. received $145.1 million in limited partner distributions from OKS, which increased to $235.4 million in 2012. This represents an annualized growth rate in limited partner distributions of 10.1%
In comparison, in 2007 Oneok Inc. received $58.5 million in general partner distributions from OKS, which increased to $201.3 million in 2012. This represents an annualized growth rate in general partner distributions of 28%.
The total annual growth rate for distributions received from OKS (meaning both limited and general partner distributions) was around 16.6% per year for this period. This growing stream of incoming cash flow to Oneok Inc. is what fuels the continued dividend growth to their shareholders.
The reason the general partner does so well, if properly managed, is that they get an ever-increasing percentage of the total cash pie, and the overall size of the cash pie grows. So they get a larger share of a larger total, which compounds into a very large internal growth rate. The growth of the total cash pie is fueled by issuing more limited partner units, and if that money is invested well, it can increase the revenue for the overall partnership and increase distributions for all limited partner units. For the 2007-2012 period, OKS increased its outstanding unit count by about 4.5% per year on average, although OKE was itself a major purchaser of these units.
In 2007, Oneok Partners LP paid around $385 million in total distributions. Of this, around 15%, or $58.5 million, went to the general partner share, and the rest went to the limited partners (of which Oneok owns a substantial portion as well).
By 2012, Oneok Partners LP grew as a whole, and paid $761 million in total distributions. Of this, around 26%, or $201.3 million, went to the general partner share, and the rest went to the limited partners (of which Oneok still owned over 40%). During this five year period, the total distributions from the partnership, nearly doubled from around $385 million to around $761 million, the percentage that went to the general partner increased from 15% or so to over 26%, and therefore the distributions to the general partner increased dramatically from $58.5 million to $201.3 million; an almost 3.5x increase.
Even as Oneok Inc. slowly reduces its share count, OKS will likely continue to increase its unit count, which brings in more capital, grows the total cash pie, most likely grows the distributions per unit, and therefore continues to significantly grow the general partner distributions to Oneok Inc.
Risks
The performance of Oneok Inc. is heavily reliant on Oneok Partners LP. While Oneok Inc. does hold its own distribution and energy services segments, the real growth engine for the company over the last 5-6 years has been the LP. If Oneok Partners LP cuts its distribution at any point, not only will Oneok Inc. have its 41.4% limited partner share cut, but they’ll also have their general partner share cut even more dramatically due to the IDR agreement and the aforementioned target distribution thresholds.
More risks are discussed in the OKS analysis.
Conclusion and Valuation
Oneok Partners LP (OKS) is currently in a very strong position of growth with several years of planned investments. Oneok Inc. (OKE) has an even better structural advantage as far as the investment is concerned, because in addition to having exposure to the growing distributions to the limited partners, they enjoy the disproportionate growth of the distributions paid to their solely owned general partner, and they also hold separate assets.
Even a great business, however, can make for a lousy investment if the price isn’t right. As described in the OKS analysis, I believe OKS is at an undervalued price. OKE, however, continues to hit new high water marks of price as it’s fueled by this strong general partner growth.
OKS grew its per-unit limited partner distribution at a 5.5% annual growth rate over the last five years. OKE enjoyed this annual limited partner distribution growth, but also increased its number of limited partner units and enjoyed strong general partner growth. OKE’s total distribution growth from OKS has averaged 16.6% over the last five years. The 2011-2012 growth was over 30%, and management’s predicted 2013-2012 growth is around 25%. Meanwhile, OKE’s stable natural gas distribution income, and their slightly diminishing share count due to repurchases, help per-share growth for OKE investors.
Using a two-stage Dividend Discount Model, if Oneok Inc. grows its dividend by 10% per year on average over the next 10 years followed by 6% thereafter, then with a 10% discount rate (a reasonable target rate of return), the intrinsic fair price will be slightly over $50. This is about a buck less than the current share price, but with this high dividend growth rate, the estimate has a significant margin of error.
Overall, I believe OKE to be approximately fairly valued. It’s not a cheap stock in terms of valuation, but the expected growth does appear to justify the current price.
Generally speaking, I prefer to own publicly traded general partners such as ETE and KMI if given the opportunity. However, if the stock valuations favor the publicly traded limited partnership instead, and if the limited partnership continues to grow its distribution well (as OKS is expected to do, based on its growth plans), then the limited partnership can sometimes be the preferable investment. It’s certainly the preferable investment if you’re after a high current yield. I currently believe OKS is moderately undervalued, while OKE is fairly valued. But OKE as the general partner is in a position to achieve a better rate of return, which may approximately balance out the total returns for investors. I expect that both investments will do well over the long term.
It’s worth pointing out, as usually is the case for publicly traded general and limited partners, that insiders own a much larger portion of Oneok Inc. than Oneok Partners LP. CEO and Chairman John Gibson is reported to own over $30 million worth of Oneok Inc., but under $3 million of Oneok Partners LP.
-Oneok Partners LP appears to be a good choice at an attractive price for a combination of a high distribution yield and moderate distribution growth. As an MLP, investors are responsible for the greater tax complexity during tax season.
-Oneok Inc. appears to be a reasonable choice at a fair valuation, despite the ever-increasing stock price, for a combination of moderate dividend yield and high dividend growth. As a regular stock, investors have a simpler time during tax season.
Full Disclosure: As of this writing, I have no position in OKS or OKE, but they’re on my watch list. I am long ETE and KMI.
You can see my dividend portfolio here.
Strategic Dividend Newsletter:
Sign up for the free dividend and income investing newsletter to get market updates, attractively priced stock ideas, resources, investing tips, and exclusive investing strategies:


OKE had a big pullback today due to missing their quarterly estimate. They did, however, reaffirm expected net income for the year and announce a planned dividend increase for July.