Today I’m going to war. I’m taking my double-sided axe and putting my mean face on. I will need the warrior spirit because I’m about to tackle one of investing’s sacred beasts: high dividend yielding stocks. Dividend investing is quite popular among income-seeking investors. If you intend to live off your portfolio revenues, what could be better than picking high dividend yield stocks and never touching your capital? Imagine a portfolio yielding 7-8%. That means you would *only* need between $500K and $600K in the market to retire without any stress. But behind their friendly faces, high dividend yielding companies hide a terrible truth. I’ll share it with you, but first, let me tell you what I consider a high yield stock.
High-Yield Stock Definition
The definition of a high-yield stock isn’t the same for everyone and I couldn’t find a commonly accepted definition. It seems that each investor, analyst and market expect has their own idea of what a high yield should be.
First, I think it depends in which investing era you belong. If you look at the 1980’s, I guess a dividend yield of 5% would not qualify as a “high yield”. After all, you could have picked bonds and GIC’s with much more generous yields.
Since we are pretty far away from the 80’s yield, let’s look at what could be considered a high yield today. The Dividend Guy Blog keeps a list of the dividend achievers. The Dividend Achievers Index refers to all public companies that have successfully increased their dividend payments for at least ten consecutive years. As of January 2019, the average yield from the dividend achievers was 2.88%. While this number isn’t really high, it’s still a lot better than the S&P 500 average (about 1.80%).
I don’t think it would be fair to consider anything over 3% as a high yield just because it beats the Achievers list average. In our current investing environment, a dividend yield over 5% should be considered as a high yield. Anything above 5% is a lot more than what is offered by most fixed income or whatever “safe investments” you would consider.
Dividend Yield Calculation
I know, dividend yield calculation is basic for many investors, but I need to make sure everybody follows me for my first argument. Plus, I sometimes have the feeling some investors forget how this simple calculation can have an important impact on their portfolio. So here we go:
Dividend Yield = Annual Dividend Payment / Current Stock Price
This also means high divided yields are the products of two factors:
- A dividend payment increasing while stock price stagnates
- A stock price decreasing while the dividend remains the same or increases
Let’s take a look at both factors separately.
A dividend payment increasing while stock price stagnates
This is probably the hardest case to find. When a company shows a strong dividend growth policy, the stock price tends to follow close behind. Continuous mid-single to high-single digit dividend increases are usually announced by growing companies with sound balance sheets. You are not likely to find a struggling company becoming overly generous with their shareholders.
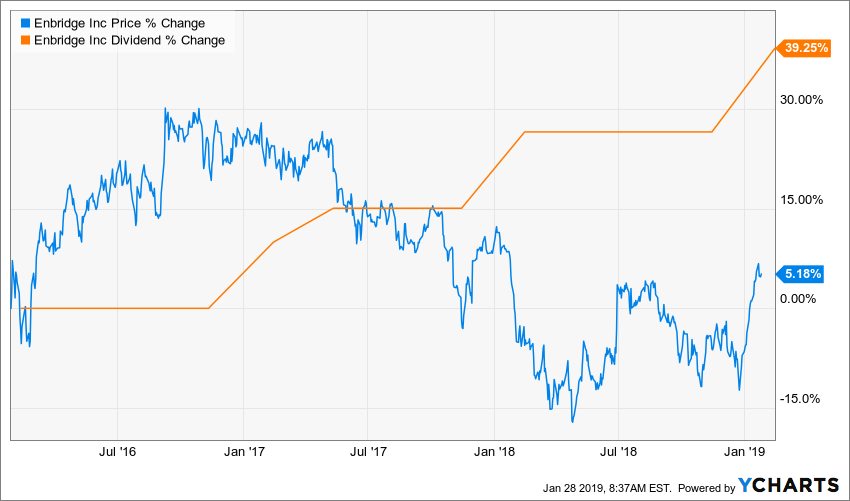
Nonetheless, some additional risks or investor concerns could pop into the picture and make the stock price lag while management remains confident in their plan. One of the best examples I could find was Enbridge (ENB.TO or ENB).

Source: Ycharts
Enbridge owns and operates an impressive network of liquid (Oil) and natural gas pipelines such as the Canadian Mainline system (which represents approximately 70% of Canada’s pipeline takeaway capacity). ENB can transport energy from coast to coast and from north to south. ENB shows a model of stability and predictability for shareholders as 98% of its estimated EBIDTA for 2019 is regulated. Enbridge is responsible for about 25% of crude oil and 22% of all-natural gas transportation across North America.
Management was quite reassuring after ENB beat both EPS and revenue estimates last quarter. The company completed the sale of $5.7B of non-core assets and still has $1.8B of assets on the block. While ENB suspended its DRIP plan, management claims no additional equity capital is required to fund the current $22B secured growth program. ENB generates more cash flow and management expects to meet its 2018 guidance. Surprisingly, ENB meets my 7 dividend investing principles.

Source: Ycharts
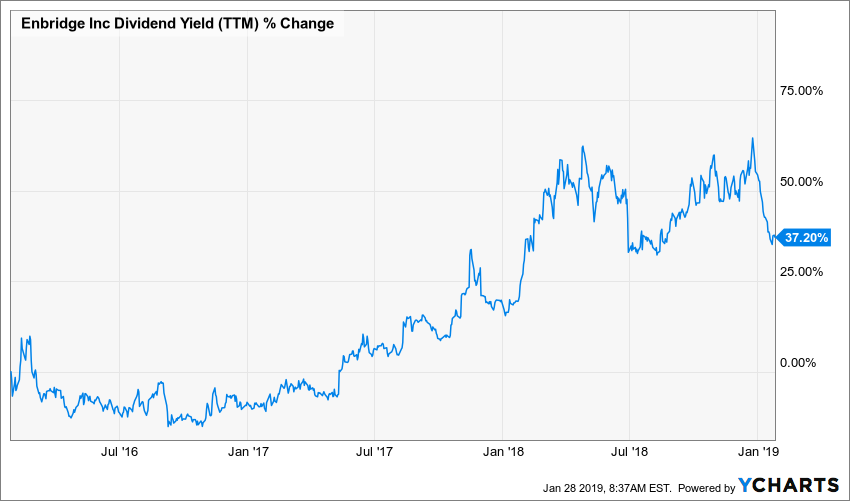
Unfortunately, Companies do not pay a high yield for nothing. As you can see on the graph above, since the stock price has stagnated over the past 3 years, ENB’s dividend yield jumped by 37%. Not too long ago, ENB was paying a “respectable” 3.5% yield.
Why is the yield is so high?
ENB raised its debts and number of shares with the merger of Spectra and more “balance sheet items shuffle” is expected with the upcoming integrations of all partners. Because pipelines require lots of capital to build and maintain, Enbridge may find itself in a position where cash is lacking. After all, management has plenty of projects to fund, a double-digit dividend growth promise to keep and larger debts to repay. There is always a possibility where this scenario turns bad. Finally, regulators may not be as enthusiast as Enbridge regarding new pipeline projects. This could seriously jeopardize the company’s growth plans.
In other words, although management is confident in its business model, the market is less enthusiastic about their plan. For that reason, more courageous investors benefit from a higher yield than usual for a solid company. Keep in mind that General Electric was once considered a solid blue chip too.
Nevertheless, this is one of the rare moments where I will take a second look at a high yield stock and may consider it. After all, dividend growth is at the center of my investing strategy.
A stock price decreasing while the dividend remains the same or increases
The second case in which a company is stuck paying a high yield is when the company’s business isn’t going that well and share prices decrease. The dividend may increase modestly, but in most cases, we see a dividend with no increase.
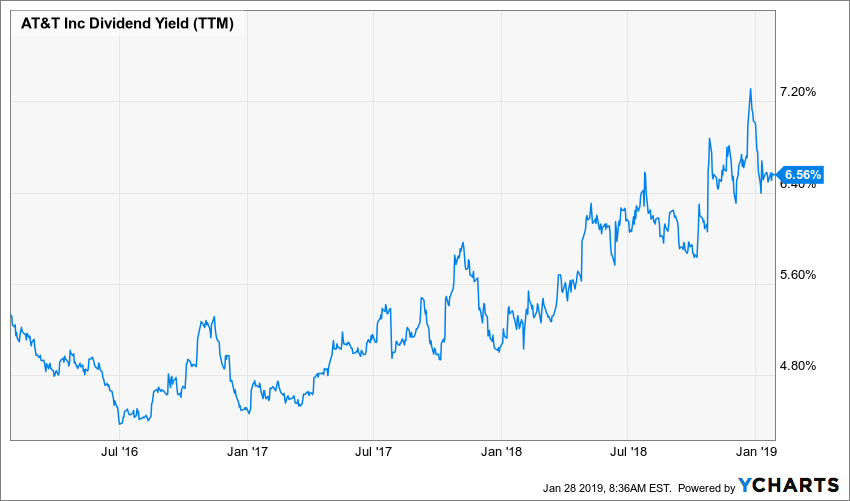
One of the best-known examples of a popular dividend yielding stock is probably AT&T (T). The telecom giant is known for its generous dividend and has rarely shown a yield under 5%. However, the reason the yield is now well above 6% is all related to a plummeting stock (-15% in the past 3 years).

Source: Ycharts
AT&T doesn’t need presentation. It is the largest telecom in the world by revenue. With over $160 billion in revenue, a 6%+ yield, and 34 years with consecutive dividend increases, the big T is a favorite among income seekers. Really, what’s not to love? Unfortunately, we can say that the stock performance hasn’t impressed anyone in the past 5 years. Even by including its juicy payout, T is behind the market by 60%. The problem is that T requires lots of cash flow to shift its business (find growth vectors), expand to 5G and continue rewarding its shareholders.

source: Ycharts
Why the is yield so high?
AT&T faces strong competition. T-Mobile and Sprint have aggressive offers to attract customers. Both are smaller, but quicker to offer what customers want; unlimited data. While T expects to retain its clients with Direct TV (they must pay for specific bundles to obtain it), T-Mobile offers Netflix for free in its unlimited data packages. A 5G network is next. Sounds like growth potential. But it means more investments to improve T’s network. Then again, debt and capital expenditures are rising. Neither of these help T’s dividend situation.
This is how T’s yield went from under 5% in January 2017 to over 6.50% two years later. The market is losing faith in the company, shares are dropping and the yield is now getting close to being too good to be true.
By definition, high yield doesn’t always mean high returns
The lesson learned from both situations is quite simple; there is no free lunch in finance. Therefore, when you have a high yield, it is often because there is a problem with the company or its future. It doesn’t mean all high yield stocks are bad investment (after all, I own shares of ENB!). But thinking an investment in a 5%+ yield is a safe bet is a bit foolish.
In most cases, high yielding stocks do very well during bullish markets. My first case against high yielding stocks proved it. But then I did some more back testing in troubled waters two years later. The article on Seeking Alpha shows that high yield stocks don’t do so well when the party is over. Interestingly enough, this wasn’t even a bear market!
But those two articles are not looking at the big picture. For that reason, I tried to find statistics with a larger scope. I used Ycharts to pull out all stocks (excluding OTC market, including both Canadian and US markets) paying a yield over 5%, compared to a yield between 1.5% and 4.99%. Here are the results showing their total returns for the past 12 months and 5 years (as of January 29th). Then, I added a 5% dividend growth rate (total) for the past 5 years. It’s interesting how the total return shows us how dividend growers did better than any other companies in the last 5 years.
| Dividend Yield | Number | Avg Yield | Avg 1yr | Avg5yr |
| 5%+ | 520 | 9.38% | -7.38% | 17.85% |
| 1.5% to 4.99% | 1207 | 2.86% | -7.33% | 53.83% |
| Div Growth 5 years | 636 | 2.77% | -7.06% | 61.66% |
Data: Ycharts
What those stats tell me is that there are great companies paying a 5% yield. After all, they did as well as the lower yielding stocks over the past 12 months. However, if you don’t pick them right, you will seriously lag the market when you consider the long haul. Keep in mind that with an average yield of 9% and a total return over 5 years of 17%, all you actually received was dividend and the value of your portfolio today is probably not be in good shape. Now imagine what will happen when the market really drops…
Identify Red Flags Telling You It’s a Bad Dividend Stock
In 2018, we created retirement portfolios generating between 4.5% and 5% yields to ensure a decent source of income. We made sure the holdings increased their dividends to at least match the rate of inflation. We succeeded in building those portfolios following our investing principles along with three additional rules:
- Aim for 4-6% yield for most stocks
- Add some Dividend growth to cover inflation
- Avoid sector concentration
Since we are playing in with high yielding stocks than usual, we also identify a list of red flags we follow quarterly. They are mentioned in an article at the Dividend Guy Blog.


Given the way you identified stocks, of course dividend growers yield better returns than non-growers. Your backtest is flawed. You need to select your stocks, e.g., dividends growers, high yield , etc., in a past time period and see how they perform in a future time period. For example, do your stock selection using data from 2008 to 2013 and then track performance during the 2013 to 2018 time frame. If you do your selection using 2013 to 2018 data and then measure performance during 2013 to 2018, you have a meaningless result.
You are right that my calculations aren’t perfect. In fact, I didn’t have time or resources to compete with Ned Davis Research ;-).
In my article, the high yield is the result, the consequence, of what happened. Therefore we can’t predict the future with those data. But we cannot really expect to predict the future anyway.
A perfect way would be to identify the same filter back in 2013 and then test checked what happened over the next 5 years. I would also picked all companies that cut their dividend and don’t show a yield anymore (which would be another hit in the high yield department). Unfortunately, this type of data is very hard to find…
What do you expect happens to dividends of long-term reliable div. payers like Big Oil (i.e. XOM or RDS) now that the bear has arrived and we will probably see a major drop in GDP (and of course earnings) according to respected oracles like Goldman-Sachs and B of A, and recession? Obviously their dividends have suddenly increased by 50% and more in a matter of weeks as their share prices tanked. Of course they can and may cut dividends before the prices rise again, but they may want to avoid reputation damage by cutting, as long as they can still cover payouts by temporarily suspending capex or shutting down some production. If they follow that track then those who buy at the bottom may later be the happy owners of a high (say 10-12%) payout plus a 70% to 100% profit in the stock.