Summary
-National Health Investors (NHI) is a REIT that invests in income-producing properties in the health care industry.
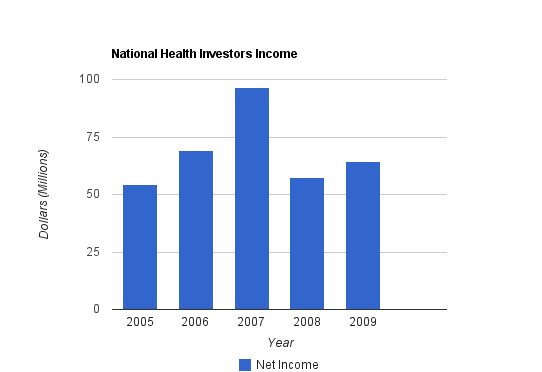
-Net income has been fairly erratic.
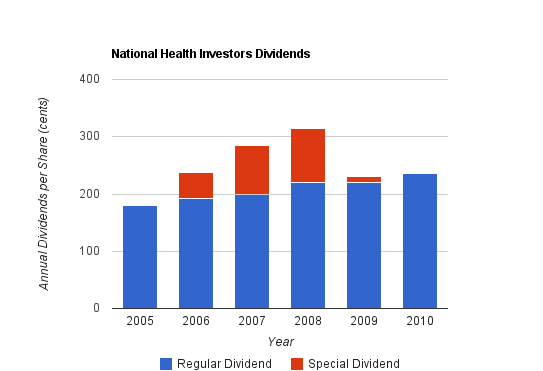
-The regular dividend has increased by an average of 5% annually, and NHI also offers a special dividend during certain years. (The dividend graph below excludes the special dividend of 2010 because it is not known.)
-The current yield is over 5%.
-The balance sheet is exceptionally strong.
-With the recent run-up in price, I currently find NHI to be mildly overvalued, but worth keeping an eye on.


Overview
National Health Investors (NYSE: NHI) is a REIT that invests in health care properties primarily in the long-term care industry.
Real Estate Investment Trusts (REITs) offer an interesting option for dividend investors. As a pass-through entity, a REIT can pay out all of its taxable earnings as dividends and then count those dividends against earnings for tax purposes.
In addition, REITs have tax advantages in the form of depreciation. Companies generate a certain amount of cash, but then have to subtract depreciation of their assets from that number (among other things) to calculate the net income. Typically this makes sense, because assets become less and less valuable over time as they wear out. With REITs, however, depending on the type of property they invest in, their asset values might actually increase over time. This is the nature of property. And yet, regardless of the actual value fluctuations of their properties, the book values of the properties are being decreased in value due to accounting depreciation each year, so their earnings do not factor these benefits in.
For this reason, the Funds from Operation (FFO) metric is typically used to represent the true profitability of a REIT rather than earnings. FFO is calculated by adding depreciation and amortization back to the net earnings. A result of this is that REITs can often have a sustainable earnings payout ratio of above 100% as long as their FFO payout ratio remains below 100%. To put it concisely, REITs offer sustainable, high yields.
Net Income
| Year | Net Income |
|---|---|
| 2009 | $64.229 million |
| 2008 | $57.510 million |
| 2007 | $96.435 million |
| 2006 | $69.228 million |
| 2005 | $54.408 million |
Net income has been erratic. 2007 net income included a $24.2 million asset write-down in addition to untypically high extraordinary items (~$17 million for 2007 vs ~$6 million for 2009). When those are factored out, 2007 income was more in line with the other numbers. With this in mind, net income growth has been mildly flat. Income for 2010 has so far been an improvement over 2009.
It should also be noted that the source of income has been shifting. Rental income has been increasing while mortgage income has been decreasing over this period.
Funds from Operations
| Year | FFO |
|---|---|
| 2009 | $72.6 million |
| 2008 | $65.2 million |
| 2007 | $94.9 million |
As far as REITS are concerned, FFO is a more reliable indicator of dividend potential than earnings are. FFO is typically higher than earnings because it factors out depreciation and amortization and a few other items from earnings. The numbers again are a bit misrepresented in 2007 due to previously mentioned items.
Dividends
National Health Investors pays out a quarterly regular dividend in addition to an annual special dividend.
Dividend Growth
| Year | Regular Dividend | Special Dividend | Yield |
|---|---|---|---|
| 2010 | $2.36 | ? | 4.90+% |
| 2009 | $2.20 | $0.10 | 7.20% |
| 2008 | $2.20 | $0.94 | 10.50% |
| 2007 | $2.00 | $0.85 | 9.50% |
| 2006 | $1.92 | $0.45 | 8.50% |
| 2005 | $1.80 | $0.00 | 6.40% |
The regular dividend for 2010 is projected based on current numbers, and the special dividend for 2010 is as of yet, unknown. Over this five year period, NHI has increased its regular dividend by more than 5% annually, on average, although not every single year included an increase. The special dividends are a useful way to return excess cash to shareholders and boost the overall dividend yield. The yield on this investment has been very attractive over the past several years but is currently a bit reduced due to a significantly increased share price. Based on regular dividends this year, the yield should be at around 5% and depending on the special dividend may exceed 6% but still should remain below all other years on this list.
Balance Sheet
National Health Investors has a balance sheet that is quite strong for a REIT.
As of the latest quarter (Q3 for 2010), NHI has $497 million in assets and less than $57 million in liabilities.
Investment Thesis
Long-term health care trends are well known in the United States. The assets of National Health Investors mainly consists of skilled nursing facilities and assisted living facilities. The baby boomers are growing older, health costs are increasing, and people are taking worse and worse care of their health. In order to live as long as people do, tremendous amounts of money are typically spent on health care. NHI primarily focuses on the long-term care industry and should benefit from the aging boomers. In addition, being a REIT, it offers a higher yield than many other health care related stocks offer.
The lease rates that NHI receives are typically in the range of 9-12% per annum. They purchase investments with in-place leases, and also finance construction of new facilities.
NHI leases for 10-15 years with additional 5-year renewal options. The leases are triple net leases, which means the tenant is responsible for most costs including maintenance, taxes, insurance, utilities, and so forth.
The balance sheet is very strong, so NHI could leverage itself to expand if management chooses to do so. Given two REITS with everything being equal except debt, the one with considerably less debt will typically be the better investment.
Risks
NHI faces risk of tenants not being able to pay their leases, and borrowers not being able to pay their mortgages. They also face competition, and must continually make new investments to remain profitable. In addition to the usual risks associated with any business, NHI is vulnerable to changes in Medicare and Medicaid. A substantial portion of NHI revenue comes from Medicare and Medicaid, and these programs are highly regulated and subject to change.
Conclusion and Valuation
I wrote most of this analysis months ago, and while it has been in my backlog of stock analysis reports, NHI’s price has continued to soar. The yield has therefore been shrinking and the company has become less and less of a value. The P/E is now a bit over 20, and the price to FFO ratio isn’t much lower.
NHI has a great balance sheet and operates in a very appealing industry for long-term growth and safety. The yield offers substantial current income. I feel that REITs, across the board, are overvalued to some extent at the current time, and this includes NHI. While I would not consider this a bad long-term investment, I advise caution and believe there are better opportunities elsewhere in the market. It may make for a good buy if there is a decrease in the stock price, so it’s worth watching.
Full Disclosure: I do not have any position in NHI at the time of this writing.
You can see my full list of individual holdings here.
Further reading:
Texas Instruments (TXN) Dividend Stock Analysis
Kimberly-Clark (KMB) Dividend Stock Analysis
Chevron Corporation (CVX) Dividend Stock Analysis
Compass Minerals International (CMP) Dividend Stock Analysis
Costco Wholesale (COST) Dividend Stock Analysis

