Norfolk Southern operates a large railroad system that serves most of the eastern United States.

-Seven Year Revenue Growth Rate: 3.9%
-Seven Year EPS Growth Rate: 8.7%
-Seven Year Dividend Growth Rate: 21.4%
-Current Dividend Yield: 3.31%
-Balance Sheet Strength: Fair
The intrinsic fair value of this company has a large window due to the uncertain nature of their declining coal segment. I estimate that the current price of $60 falls within this reasonable window, and that writing options to potentially enter at a cost basis in the low $50’s through 2013 presents a larger margin of safety.
Overview
Norfolk Southern Corporation (NYSE: NSC) is a large railroad company with over 20,000 miles of track in 22 states, with connections to every major container port in the eastern United States. The company is based in Norfolk, Virginia, and came into its current form in the early 1980’s as a result of a merger.
General Merchandise Traffic
This is the largest and most diverse group of transported materials for the company. General merchandise accounted for 50% of 2011 revenue for the company, and can be broken down into five major groups:
-Automotive
-Chemicals
-Metal and Construction
-Agriculture, Consumer Products, and Government
-Paper, Clay, and Forestry Products
Coal Traffic
The transportation of coal accounted for 31% of Norfolk Southern’s 2011 revenue. The coal is used for electricity generation, export, metallurgical use, and industrial use. Of the nearly 178 million tons of coal shipped in 2011 by the company, 122 million of those tons were used for utility/electrical generation, 28 million tons were used for export, 20 million tons were used for metallurgy, and 8 million tons were used for industrial use.
Intermodal Traffic
Norfolk Southern transports trailers and containers, and this accounted for 19% of 2011 revenue.
Ratios
Price to Earnings: 11
Price to Free Cash Flow: 28
Price to Book: 2
Return on Equity: 18%
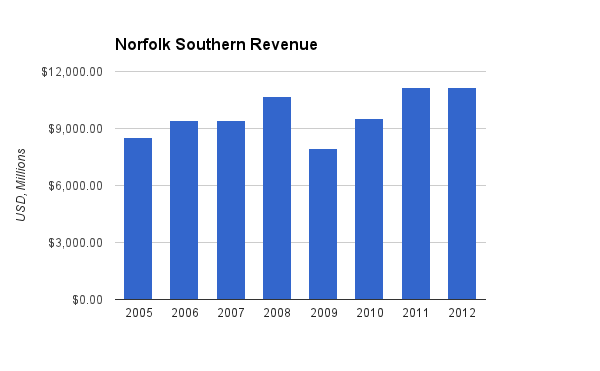
Revenue

(Chart Source: DividendMonk.com)
For these two charts, the “2012” figure is the current trailing twelve month figure. Revenue grew by an annualized rate of 3.9% over this time period, with a major reduction occurring during the economic recession.
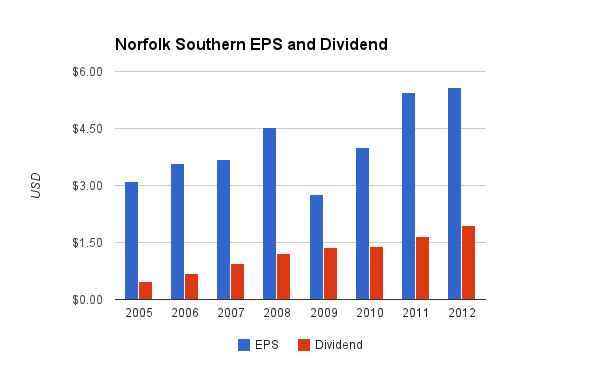
Earnings and Dividends

(Chart Source: DividendMonk.com)
Earnings per share increased by an average of 8.7% per year over this period despite the recession. This EPS growth was primarily driven by share repurchases.
The average annual dividend growth rate over this period was 21.4%, which is a combination of the EPS growth rate and a steadily increasing payout ratio. Over the long term, dividend growth must slow down to match EPS growth. However, with a payout ratio of only 35% (despite the sizable 3.31% dividend yield), the company has quite a cushion of dividend growth and dividend safety. This is somewhat lowered by their recent reduction in free cash flow, but that is discussed later and overall I believe the dividend is safe and in a position to continue growing.
Approximate historical dividend yield at beginning of each year:
| Year | Yield |
|---|---|
| Current | 3.31% |
| 2012 | 2.3% |
| 2011 | 2.2% |
| 2010 | 2.5% |
| 2009 | 2.6% |
| 2008 | 2.2% |
| 2007 | 1.5% |
| 2006 | 1.2% |
| 2005 | 1.1% |
How Does Norfolk Southern Spend Its Cash?
For the fiscal years 2009, 2010, and 2011, Norfolk Southern brought in nearly $2.8 billion in free cash flow. Over the same period, the company spent approximately $2.6 billion in net stock buybacks and nearly $1.6 billion in dividends.
Back in 2006, the company hit a peak share count of around 415 million but has brought that number down to 325 million due to regular and aggressive share repurchases. This is why despite company-wide net income only increasing at a 3.5% annualized rate between 2006 and the present day, earnings per share have increased at a 7.7% annualized rate over that same period.
Balance Sheet
Nortfolk Southern has a debt/equity ratio of approximately 85%, a debt/income ratio of a bit over 4.5x, and an interest coverage ratio of over 6.5x.
The company is using a moderate amount of leverage, but the balance sheet is in fairly good shape and debt interest is very well covered by income.
Total debt has increased from under $6 billion in 2007 to over $8 billion in 2012. The company’s debt levels do fluctuate over time, and the low interest rate environment has made leverage more appealing. This increase in debt essentially went to buying back shares, so they take on money at a lower rate of return to invest in an asset (their own stock) with a potentially higher rate of return. This makes sense to do as long as the balance sheet remains robust.
The company cannot do this perpetually, so the past few years of aggressive share buybacks should be assumed to be reduced a bit in the future unless core company income growth accelerates. This is particularly unlikely given their problems with coal, to be mentioned later.
Investment Thesis
Back in September of this year, Norfolk Southern had a stock price of approximately $75. Due to the most recent quarterly report, the stock dropped to around $56 and has since rebounded to $60. I believe a portion of this stock drop was rational; alarming decreases in coal transportation were the sole problem, and FCF levels took a hair cut.
However, capital expenditure during 2011 and 2012 has been significantly higher than historical levels. Free cash flow dropped 35% for the trailing twelve month period compared to the 2011 calendar year (which itself was moderately lower than the 2010 calendar year), but operating cash flow dropped less than 9% for the trailing twelve month period compared to the 2011 calendar year. The difference was due to the increases in capex.
Therefore I believe a 25% stock price drop from $75 to $56 was a moderate over-correction. The company has a fairly diverse revenue base, and while coal transportation presents a headwind for the company, it may also present a value opportunity for this railroad dividend grower.
Risks
Railroads commonly face the general risk of economic downturns. Reduction in economic activity means reduction in transportation. It’s nonlinear due to the high fixed costs, so mild or moderate decreases in rail traffic reduce free cash flow and earnings to a significant extent, and then mild or moderate increases in that traffic for the rebound boost free cash flow and earnings to a significant extent. The recession cut Norfolk Southern’s free cash flow in half for 2009, and reduced return on equity from over 17% down to around 10%. These rebounded, but are now threatened by reductions in coal volume.
Nearly a third of the company’s revenue comes from transporting coal, and the largest use of that coal is for generating electricity. In 2011, 31% of revenue came from coal, but this dipped to under 27% recently. The latest quarter showed a significant decline in coal shipping, and their FCF bounced low enough to barely cover the dividend (although with cash and debt the company can smooth those problems out and easily protect the dividend over the moderate term). Management cited highly competitive natural gas prices as the primary driver of the reduction in coal demand.
A decline in coal usage, either due to economics of alternative energy sources like gas, or the politics and environmental regulation of coal, would present long-term headwinds to the company. To present two more opinions on that particular area, here are two articles:
Norfolk Southern: Not a Buying Opportunity
Norfolk Southern’s Future Isn’t as Tied to Coal as You Think
Conclusion and Valuation
The company pays a 3.3% dividend yield, and a rebounding of FCF back to $1.1 or $1.2 billion would allow for the company to buy back 3-4% of its market cap in a given year without increasing leverage.
As the company’s non-coal segments likely continue to improve while the coal segment faces headwinds, the company continues to pay dividends and buy back shares. Static revenue, net income, and free cash flow for this company translates into 6-7% returns due to the dividends and buybacks, so any shrinkage or growth can be calculated from there depending on your bullishness or bearishness of the company’s coal segment. Reductions in coal volume by 5-10% per year would present a large and continuous headwind against the healthier parts of the business, but it’s not an insurmountable problem. Roughly speaking, 5% annual coal volume reductions would require 2% increases in other segment volume to offset it, and 10% annual coal volume reductions would require 4% increases in other segment volume to offset it.
At the current time I believe that the dividend is rather safe and that the company makes for a good hold. The fair price can range substantially from the high $40’s up into the $70’s depending on the extent of the reductions in coal transportation. Assuming moderate economic improvement that can offset coal reductions, I expect that the current price of $60 is fair, and on the low end.
If an investor is interested in the company but desires a lower cost basis to increase the margin of safety, then there are some opportunities. For example, selling January 2014 puts at a strike price of $60 allows one to potentially enter a position with a cost basis of only $53. If not exercised, this would result in a low double digit rate of return, and if exercised, results in acquiring the stock at a cost basis of around $53 compared to the current $60 price.
Full Disclosure: As of this writing, I have no position in NSC. It is on my watch list for potentially entering a long position, but not over the next 72 hours.
You can see my dividend portfolio here.
Strategic Dividend Newsletter:
Sign up for the free dividend and income investing newsletter to get market updates, attractively priced stock ideas, resources, investing tips, and exclusive investing strategies:


Hi DM,
How does NSC compare with its peer CSX. Can you comment on which one is a better buy.
Thanks
I have plans to review CSX to compare; they are very similar.
Thanks for the analysis Dividend Monk. I’ve recently added additional shares on weakness as well as taken advantage of selling puts to further lower my cost basis. I probably won’t add any more soon unless shares go quite a bit lower than $60. Take care.
Thanks Matt! Another great article. I like your idea on puts with this one.
NSC is on my list to look further into this month. I think the price drop could offer an opportunity to get into a decent company like NSC. Recently I noticed that NSC and CSX have been down on the year while UNP has been up. Any insight into why these Railroad companies are getting different treatment from the market? I’d be interested in looking into these further.
Hi DG,
Coal is 25-30% of revenue for NSC, CSX. For UNP, CNI it is between 10-20%.
Concern of Mr Market is that Coal is not just in cyclical decline but secular decline and hence these NSC, CSX are discounting that risk. Also most Utility companies switching from Coal to NatGas are in the Eastern half of US which is where NSC, CSX operate.
Disclosure. Long NSC, CSX