
In this second post about investment biases, we explain how hindsight and loss aversion hurt your investment decisions. We also give you tips on overcoming these investment biases to make the best possible investment decisions. In case you missed it, last week, we covered the confirmation and herding biases.
Aah! A portfolio of stocks that provide the income you need. Make the dream come true. Learn how with our Dividend Income for Life Guide!
Loss aversion/regret aversion bias
We all dislike loss and regret. We’d rather avoid both whenever possible. I think loss aversion might be the most powerful investment bias: the pain of losing money is greater than the joy derived from making money.
“In economics and decision theory, loss aversion refers to people’s tendency to prefer avoiding losses to acquiring equivalent gains: it’s better to not lose $5 than to find $5.” – Wikipedia
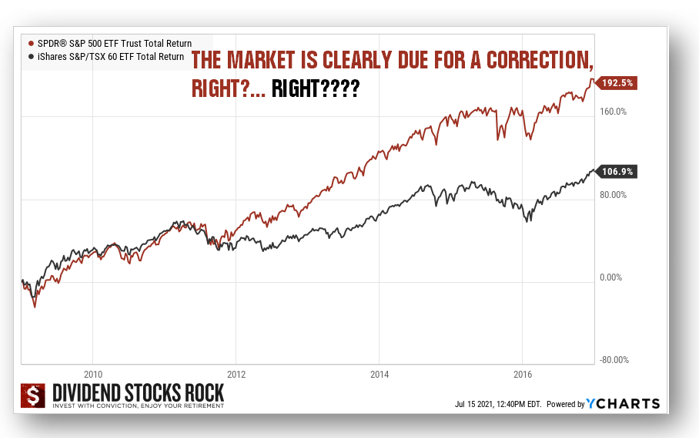
As the market recovered from the March 2020 crash, many investors kept cash on the sidelines waiting for the next dip. They feared entering the market at peak levels would result in severe losses.
When the market recovers, investors are increasingly concerned about losing their money in the coming months. They expect the market to fall any day and would rather wait to invest. When you’re about to invest $100,000, you’d rather earn $100 next month than risk losing $10,000. Often, if you fast forward a year or two, the market is still trading at an all-time high! Again, many investors will think it’s better to wait as a crash must be imminent.
Cost of loss aversion
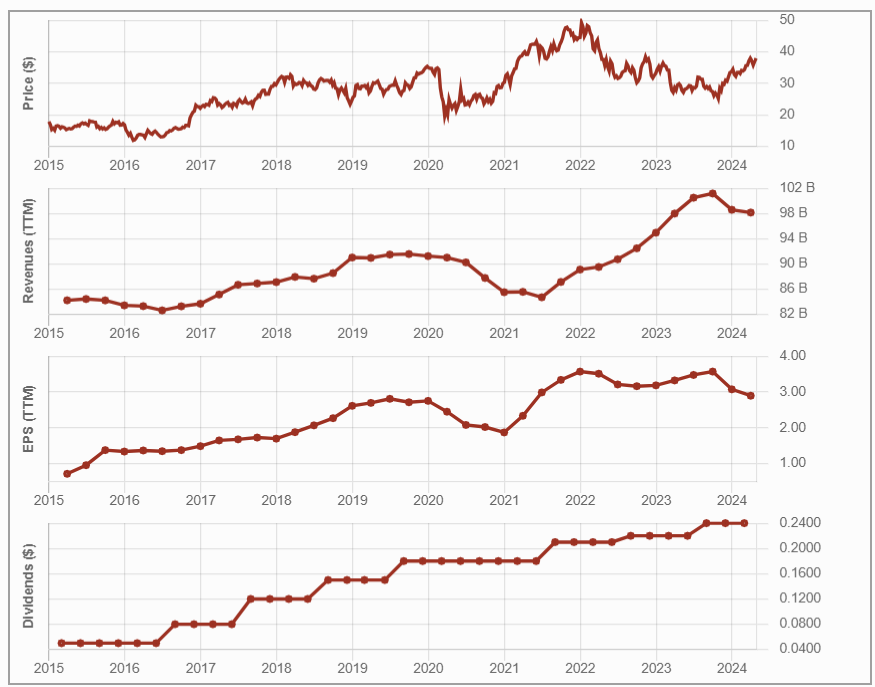
Loss aversion was widespread among investors at the all-time high in 2017.
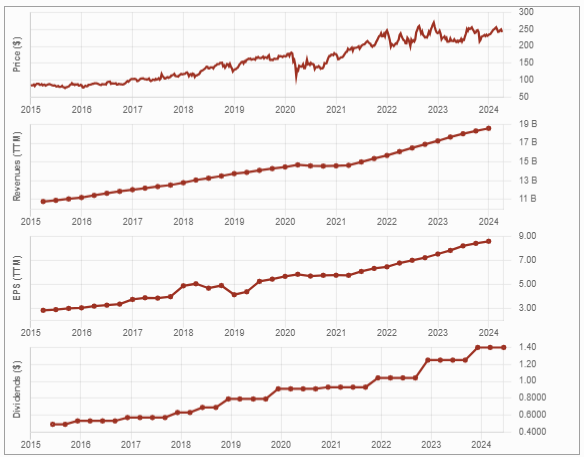
Yes, the market was at an all-time high in 2017, but look at the next graph. Clearly, someone sitting on the sidelines, expecting a crash, lost a lot more by waiting than they would have gained by investing. Over the 7 years, their portfolio could have doubled.
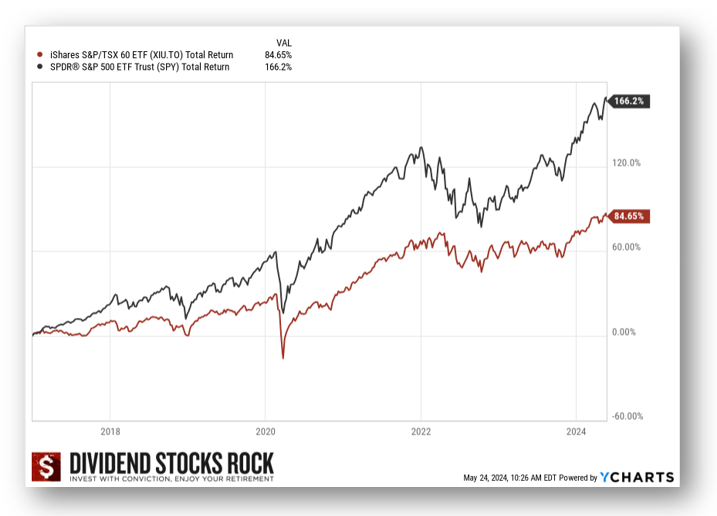
And here we are today, again, trading at an all-time high…
Nobody knows what the future will bring. Loss aversion is completely non-productive, and often accompanied by choice paralysis. There’s an overload of information that hinders the actual decision-making process.
Regret aversion causes investors to keep their losing stocks forever. Once the paper loss is digested, investors wait to recover that loss. They’d rather keep their losers than sell them now and subsequently see them go back up. This hurts a portfolio more than most people think.
Beating the regret aversion/loss aversion bias
To fight this bias, I’d say there’s nothing like getting additional knowledge and adopting a long-term investment horizon, with which I mean over ten years. If you won’t deplete your portfolio entirely in the next ten years, keep reading 😉.
A J.P. Morgan study shows what happens to a portfolio when investing at all-time highs vs. any other day. Between 1988 and 2020, investing at an all-time high produced better outcomes, with higher total returns after 1 year, 3 years, and 5 years.
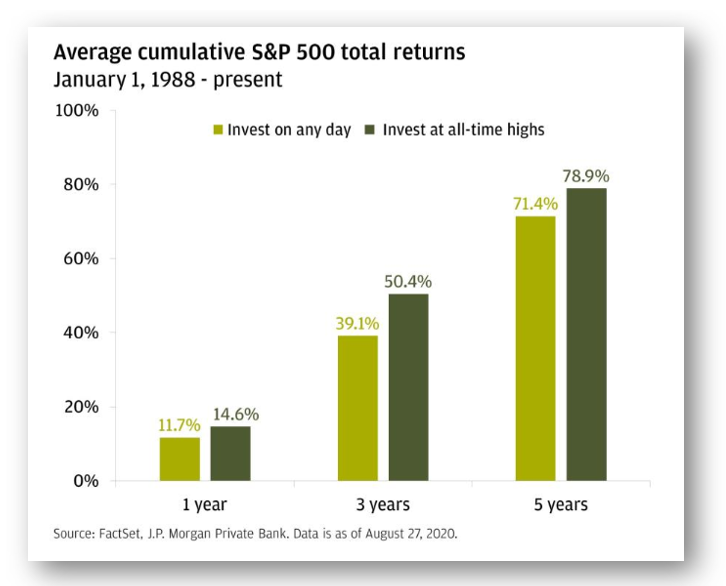
Sure, you might indeed suffer for a few months if you invest “now”, but in 5 years? You’ll be golden… most of the time! As I always say… stay invested!
Hindsight bias
The hindsight bias is akin to playing Monday morning quarterback. When you look at what happened in the past you see the reasons for how the market evolved, and find them obvious. It’s always clear when you look in the rear-view mirror.
Everybody should have known the market would crumble back in January 2020 as the virus was spreading everywhere!
Everybody should have seen the financial crisis coming.
Everybody should have bought Amazon 10 years ago because the future of retail is online!
Everybody should have ignored the Blackberry devices; it was obvious Apple would crush them!
Oddly, we even convince ourselves that those moves were obvious back then. This is mostly due to our deep desire to correctly predict the future. By looking at what happened, you select only the factors that contributed to the results, ignoring all the uncertainties at that time. Yet, try to predict the next three months…nothing seems clear in the present.
Also, remember that whatever happened in the past might not happen in the future. Each situation evolves in a different context. For example, the credit bubble burst of 2008 would not have been as damaging in the 80s since mortgage-backed securities, hedge funds, and leverage strategies (including short selling) weren’t as common then. Recalling the 2008 bubble, we might think “Yeah, that was obvious; the market had to implode”. But back then, most people didn’t know what subprime mortgage-backed securities were, and that was the problem!
Aah! A portfolio of stocks that provide the income you need. Make the dream come true. Learn how with our Dividend Income for Life Guide!
Beating the hindsight bias
I don’t think that I should have seen all past events ahead of time. I accept that sometimes I’ll be right and sometimes I’ll be wrong. I’ve been expecting a recessing since the end of 2022. It hasn’t happened, yet! (Haha!).
Most importantly, I don’t trade on hindsight. I trade based on my investment rules. Sure, I could claim that I knew the tech sector would crash in 2022 and that’s why I sold shares of Apple and Microsoft in December of 2021. In truth, I simply followed my investment rule to sell some shares when a position exceeds my maximum weight of 10%. At the end of each year, I trim my highest-performing investments if they exceed that threshold.
Following clear investment rules is much easier than trading based on hindsight.


 Here’s what I do. After writing my investment thesis focusing on all the great things a company does and why I should buy it, I take a break. A day or two to let that sink in and let the hype go down. The stock will still be available to buy next week!

 This ensures NNN has a higher occupancy rate than the industry standard, currently above 99%! While the brick-and-mortar retail store environment is rapidly shifting toward online businesses, NNN is one of the retail REITs that won’t be affected.
 NNN made sure to stay away from businesses that would suffer the most from online competition; books, consumer electronics, and office supplies each represent less than 2% of its business, and NNN has virtually no apparel-oriented tenants. The risk of oversupply of retail real estate is becoming less likely since new developments should slow down in this high-interest rate environment. Expect more conservative FFO growth moving forward.