
Several headwinds face stocks over the next few years, and I’m moderately bearish for fundamental value-oriented reasons. This article examines some of those headwinds and discusses several strategies to navigate them with decent risk-adjusted returns.
Headwind 1) High Market Valuations
According to broad valuation measures such as the Shiller P/E ratio (the price of the market divided by the ten year average inflation-adjusted earnings of the market, aka CAPE), the S&P 500 is at one of its highest earnings multiples in history. There were only three times in the last century that this valuation metric was higher: in 1929 shortly before the Great Depression, in 1999 shortly before the Dotcom Bubble Collapse, and in mid-2000’s shortly before the stock crash in 2008.
Here’s a fairly recent Shiller P/E chart:
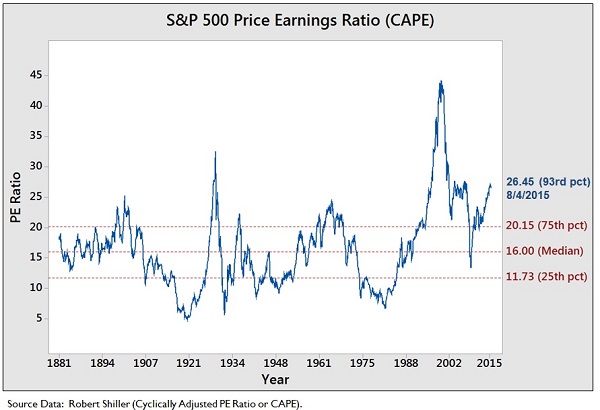
The chat stops in August but the November figure is still above 26. The Shiller P/E is by no means a perfect metric, and unless interest rates get extremely high again it’s unlikely to see a long-term market staying near historical Shiller P/E averages. But it’s a useful one, and you can see the current market valuation problem yourself on an individual company basis by examining several defensive blue-chip stocks.
Coca Cola, Pepsico, Colgate Palmolive, McDonald’s, Automatic Data Processing, and other defensive brands currently trade for 20-25 times forward earnings. They’ll likely outperform the S&P 500 during a market correction, but their likelihood of providing future returns equal or better than past S&P 500 long term performance seems low. They remain strong for growing dividend income, especially when compared to how poor the returns are from bank accounts and bonds, and some of them are great for the defensive core holding part of your portfolio, but not particularly ideal for an overall high rate of return like they have historically offered investors.
Another useful metric is to compare total US market capitalization to GDP. The market recently went up to about 118%, which is historically significantly overvalued. This metric and the Shiller metric tend to correlate very well.
Jack Bogle, founder of Vanguard, said in October that he expects a 4% rate of return over the next decade for the S&P 500, which is less than half of the historical average. His estimate is based on a 2% average S&P 500 dividend yield, plus 5% average annual EPS growth for companies in the index, minus 3% per year for earnings multiple contraction, since earnings multiples are quite high. Tweaking these numbers for slightly better growth or slightly less earnings multiple contraction still leaves investors with returns that are less than the historical average.
I think holding most or all of your portfolio in dividend growth stocks, averaging a 3% yield with substantial dividend growth, and avoiding some of the highest valued companies, will probably outperform Bogle’s market prediction. But still, I think he’s largely correct about the overall state of the market and that it will negatively impact returns over the next several years.
Headwind 2) Interest Rates Will Likely Mildly Increase
The U.S. Federal Reserve has held interest rates at historically low levels for a historically long period of time due to the fragile economy. It’s been close to a decade since the Federal Reserve increased interest rates, and we’ve been at at near-zero rate for most of that time. This has been a decreasing trend that has extended through multiple market cycles.
Here’s a fairly current and historical Federal Funds Rate chart:
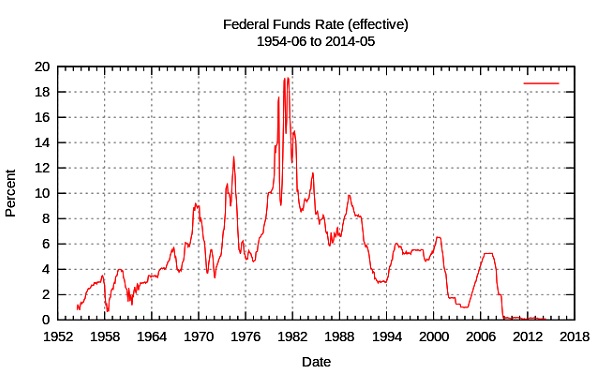
All else being equal, low interest rates push the stock market up. You can see the inverse correlation between interest rates and market valuations by comparing the charts for the Shiller P/E and the federal funds rate, but it’s also a conclusion that can be arrived at with reason. Low interest rates give companies easy access to cheap capital, meaning they can borrow large sums at low rates and use that money to expand or otherwise earn a rate of return that exceeds these negligible borrowing costs. People can access cheaper capital to start new businesses, and existing businesses can access cheaper capital to expand their operations. Even if a corporation simply borrows money by issuing low-interest bonds and uses that money to buy back its own stock, it pushes EPS growth and the stock price up at a faster rate than it would if borrowing costs were higher.
Low interest rates also drive people into stocks because other investment classes become less desirable. When bank savings accounts and bond yields are giving rates of return that don’t even keep pace with inflation, investors naturally seek out investments that provide better returns. This especially includes dividend-paying stocks, but also includes the broader stock market in general. People have flocked from other forms of investments into equities over the past several years as interest rates have been near-zero (and on a longer trend over the past few decades as interest rates have had a long-term decline), therefore inflating current equity valuations to historically high levels. Not quite into bubble territory, but certainly into danger territory.
It’s likely that the Federal Reserve will begin slightly increasing rates at the end of 2015 or at least in 2016 according to statements they’ve made. But I’m not interested in making predictions here, since for long term investors the timing of interest rate changes doesn’t matter much. The fact is, interest rates are at rock bottom and don’t really have anywhere to go besides approximately sideways or up over time, which is the main message here.
It’s unlikely that interest rates would go very high like they used to be; they’ll likely remain at lower levels than historically. One of the reasons for the Fed to increase the interest rate is to keep inflation in check, but the inflation rate is already low and the US dollar is currently at extremely strong levels compared to foreign currencies such as the Euro and the Yen. So there’s little current incentive for the Fed to do anything more than mild and gradual rate increases.
These eventually rising interest rates wouldn’t necessarily be a cause for a bearish outlook if it weren’t for the previous headwind of high market valuations. Stock prices are already at a high valuation premium, and interest rates can mostly only go sideways or up, which puts pressure on those high stock prices.
Headwind 3) The Economy Remains Fragile
Although the average US citizen is in better financial shape than a few years ago, and the rate of loan delinquencies has decreased dramatically, and credit card debt has stabilized, there are numerous structural problems that remain.
Official unemployment levels in the U.S. are low at around 5% now, but unofficial levels remain high. This includes people that are underemployed compared to their level of education and experience, people that are not working as many hours as they’d prefer, and people that have given up looking for work altogether. And over 46 million Americans are on food stamps.
Although the total household net worth in the United States is at a record high of $85 trillion, the middle class is not very healthy. Existing student debt is extraordinarily high compared to prior decades, and the cost of saving for future college expenses of children is at historically high levels. Americans (both individuals and their employers) spend a larger amount of money on healthcare per capita than any other country in the world. Pensions for workers have been largely replaced by 401(k)s and most people have not proven to be good stewards of their retirement accounts, and the pension funds that still exist are expecting an average of 7% annual S&P 500 growth going forward for their investments, and would have problems if the S&P 500 has returns that are closer to Jack Bogle’s estimate. Average lifespans have lowered the ratio of the number of workers compared to the number of retirees, putting pressure on the financial health of social systems like Social Security and Medicare, eventually necessitating either additional cuts or taxes to fix them. Average personal savings rates are low, due to the cultural tendency towards consumerism but also due to the previously mentioned increasing costs of healthcare and education compared to historical norms. International trade agreements have not helped domestic manufacturing, and automation is increasingly putting pressure on low-skill jobs. All of this and more makes current and future disposable income for the working class and middle class appear not very strong.
Since consumer spending accounts for over two thirds of the US economy, the middle class is the core engine of growth, and so a fragile middle class does not bode well for the long-term health of the American economy, and would have a limiting effect on domestic corporate performance.
Other regions of the world are not currently in great shape either. Continental Europe has low growth and substantial sovereign debt, Canada has a very expensive housing market, Japan has long-term economic stagnation and the highest sovereign debt-to-GDP in the world, China’s growth is maturing and therefore slowing, Brazil is in a recession, and Russia’s economy is suffering from low energy prices.
Again, this wouldn’t necessarily be a problem for stock investors if stock valuations weren’t already so high. It all comes down to valuations, because if valuations were much lower, then these headwinds like eventual interest rate hikes or middle class fragility would already be factored in. The best investment opportunities generally arise during times of economic weakness, but in the current environment, there is global economic malaise mixed with historically exuberant stock valuations.
These three headwinds together should give a bearish outlook on equities, not for technical reasons of short term stock movements, but for fundamental reasons relating to future business performance and discounted cash flow analysis of the fair price of their shares compared to current prices.
If I were to pull out my crystal ball, I’d suggest that the next five years in the market will likely be choppy and sideways with occasional surges and corrections, rather than generally upwards as the last five years have been. Valuations have outpaced growth, and now growth needs to catch up with valuations a bit. But since I don’t have a crystal ball, all I can say with actual evidence is that reasonable expectations of future corporate earnings growth do not appear to fully support current stock valuations as determined by methods such as discounted cash flow analysis, at least if one expects to get anything approaching the historical S&P 500 rate of return. The markets are somewhere between fully valued and somewhat overvalued, though fortunately not irrationally overvalued.
The explanation for this situation, I believe, is that as mediocre as future equity returns are likely to be, most other asset classes offer even worse opportunities for returns due to low interest rates, which keeps people invested in equities anyway. Stock valuations are high and they’re not necessarily irrational or due for correction, since there aren’t many other good investment alternatives available.
A Few Stocks to Consider
All that being said, there are almost always reasonably priced opportunities to add to a portfolio. Some of these examples can benefit from some of those broad market headwinds rather than be hurt by them.
U.S. Bancorp (NYSE: USB)
Banks generally benefit from rising interest rates, unlike some other industries. They make a lot of their money by borrowing at short term low interest rates (like saving and checking accounts) and then lending at longer term higher interest rates (like mortgages, car loans, business loans, and personal loans). So when interest rates rise, they can generally enjoy a bigger gap between their borrowing and lending interest rates. When interest rates are low, their net interest margin gets squeezed, and when interest rates rise, their net interest rate margin expands noticeably.
I don’t think investors should invest in a stock just for the sake of expectations of changing interest rates, because interest rate increases will likely be mild, gradual, and partially unpredictable. But most banks are currently trading at reasonable valuations, pay decent dividends, and stand to benefit mildly from increasing interest rates while already being profitable in the current environment, and so they are are good all-around choices today. And I believe U.S. Bancorp is among the better bank investments at the moment.
US Bank, subsidiary of US Bancorp, is the fifth largest bank in the United States, although it’s only about a quarter the size of the fourth largest by assets, Wells Fargo. So US Bank is the largest of the mid-sized banks, but much smaller than the four “Big Banks” JP Morgan, Bank of America, Citigroup, and Wells Fargo.
US Bancorp currently pays a 2.3% dividend yield and the previous three annual dividend increases were 4.1% in 2015, 6.5% in 2014, and 18.0% in 2013. The payout ratio is about 30-35%. The company has a consistent history of annual dividend growth with the major exception of 2009/2010 when dividends were cut like most other banks.
US Bank held up better during the financial crisis than almost all other medium and large banks, with a lower percentage of net loan charge offs and a quicker recovery. The company did receive government funds, and was able to acquire weaker banks during the crisis, and quickly repaid those funds.
The credit quality of the bank is rated at the very top of its peer group of medium and large banks by all of the rating agencies, including above JP Morgan and Wells Fargo. And after a recent upgrade in October, US Bank currently is tied with the highest credit rating by Fitch of any bank in the world.
The bank has the highest return on equity and the highest return on assets in its peer group of medium and large banks. It also has the lowest efficiency ratio in the peer group, meaning the bank does a better job of controlling expenses than other banks. The net interest margin is about 3%, in line with the peer group, and the percentage of net charge offs is under 0.5%, also in line with the peer group. Higher interest rates could push the net interest margin to 3.5%-4% eventually, depending on how far interest rise and for how long. Small changes in net interest margin make a big difference for net profits.
Loan growth has been substantial over the past five years, increasing from $193 billion in 2010 to $241 billion in 2014, which is a growth rate of about 4.5% per year. The latest quarter in 2015 is up to a bit over $250 billion, so growth has been slower this year. Deposit growth has been more impressive, increasing from $184 billion in 2010 to $266 billion in 2014, which is a growth rate of about 10% per year. Growth through 2015 continues to be solid, at about $290 billion by the third quarter in the year.
The P/E ratio of US Bancorp is about 14, with a forward P/E of under 13, and the P/B ratio is about 1.9. So the bank is not at the lowest valuation in its peer group, but its at a reasonable price compared to the quantitative superiority it has over its peers.
The bank is also fairly conservative, with no investment banking arm. 42% of its revenue mix comes from consumer and small business banking. 30% comes from payment services, including credit card payment processing for both consumers and merchants. 17% comes from wholesale banking and commercial real estate, and the remaining 11% comes from wealth management. Nearly half of the revenue comes from fees rather than interest, including fees for credit card payment processing, wealth management, and so forth.
The economic moat of US Bancorp is substantial. First of all, like any major bank, there are significant switching costs for most of US Bank’s services. It’s a hassle to switch out assets from consumer bank accounts, wealth management accounts, merchant payment processing, and wholesale banking, and so customer turnover tends to be low. Second, because their credit rating high, their borrowing costs for long term corporate debt are lower than peers, and this small interest rate difference is a big deal for bank profitability. Third, they fully incorporate their acquisitions rather than keep them compartmentalized, and therefore keep everything on a single processing platform, which helps keep their efficiency ratio at the very top of its peer group.
Overall, US Bancorp appears to be a reasonably priced and fairly conservative investment in an otherwise overvalued market. They’re increasing their asset base, paying growth dividends, are diversified, and stand to mildly benefit from rising interest rates.
If you want to diversify by investing in two or more banks without simply investing in all of them like an index fund, a factor to consider is the geographic footprint of those banks that you pick. For maximum diversification from minimum stocks, try to pick banks that have separate geographic footprints, so that they are not competing with each other and so that you have more geographic exposure.
Consider the geographic footprints of US Bank (top) and TD Bank (bottom) in the combined image below:
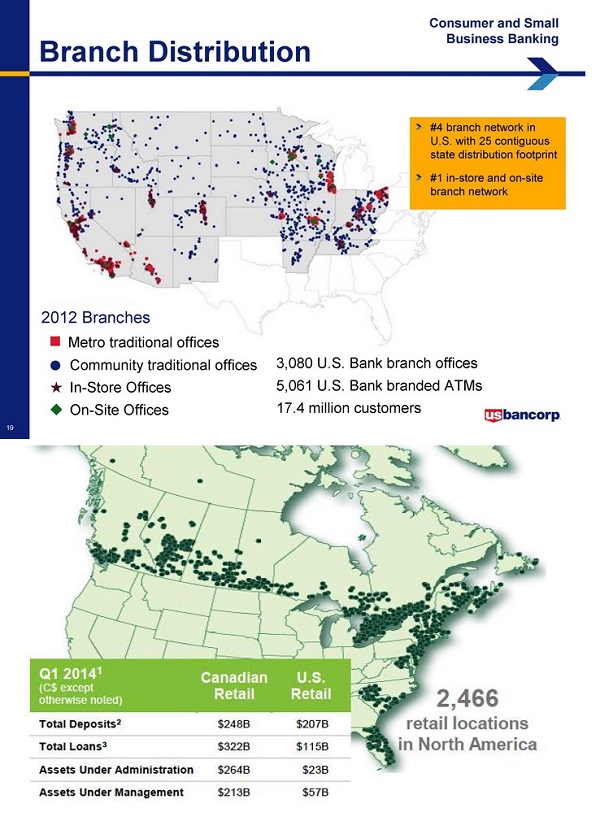
Their footprints fit together like perfect puzzle pieces. US Bank has a strong presence throughout the central United States and the west coast, while TD bank has a strong presence throughout Canada and the east cost of the United States. By investing in simply US Bank and TD, you can have broad geographic diversification across these two countries with zero physical overlap. This is a factor to consider when picking bank stocks for a portfolio, when balancing the desires for portfolio diversification and concentration.
Overall, US Bancorp appears well-positioned for risk adjusted returns at its current price of under $45.
Travelers Companies Inc. (NYSE: TRV)
Travelers Companies is one of the largest property casualty insurers in the United States. Total revenue is about $27 billion, with about $24 billion coming from insurance premiums and the other $3 billion coming from investment income and fees.
The insurance company business model is that they receive insurance premiums from a large number of clients, pay out benefits to a small number of them each year based on valid insurance claims, and hold a large revolving portfolio of money, which they can invest and keep the investment returns on. Most of their net income ends up coming from these investment returns.
About two thirds of the premiums from commercial insurance while the remaining third comes from personal insurance. Commercial insurance for Travelers includes worker’s compensation, multi-peril, automobile, property, and general liability. Personal insurance for Travelers is nearly evenly split between home insurance and auto insurance.
The company offers a fairly modest dividend yield of about 2.1%, but the dividend has grown by an average of about 10% per year over the past ten years.
The P/E of Traveler’s is just a little over 10, and the P/B is a little under 1.5. The company invests primarily in fixed income securities, especially municipal bonds, and the portfolio is very conservative with a focus on high credit rating investments. As such, Travelers itself has very high credit ratings from all rating agencies. The book value per share has grown at a rate of 9-10% per year over the past ten years.
A problem with insurance companies is that their economic moats are limited. Some of the largest insurers can be considered to have small moats due to the scale and diversification of their operations, which can give them slight cost advantages and brand recognition, but overall, it’s not an industry known for economic moats because insurance is so commodified. However, well-run large insurances companies can be quite stable blue chip companies despite this problem, and tend to trade for lower valuations than the general market. The double digit return on equity that Travelers earns in most years is evidence of at least a modest moat.
Travelers is not growing very much. Their insurance premiums have grown at a rate of under 2% per year for the last ten years, somewhere in line with inflation, but their investment income from their huge fixed income portfolio has decreased over time due to the low interest rates. This is another stock that can benefit from increasing interest rates over time rather than be hurt by them.
Revenue and net income have hardly increased at all in ten years, and yet Traveler’s EPS growth and stock performance have absolutely crushed the S&P 500 index over that timeframe. This is because Travelers uses virtually all of its profit to pay dividends and buy back its shares to reduce the outstanding share count. The number of shares has been cut in half over the last decade, so shareholders each own a larger and larger portion of the company. Therefore, while the company itself has not grown much, the value of each share has grown at market-beating rates.
Usually I have mixed opinions about share repurchases. Statistically, most management teams buy back more shares when stock prices are high and fewer shares when stock prices are low, which is not good. Just like how most investors are not very wise at buying at the right time, CEOs tend not to be wise at buying their own stock at the right time. But when performed at the right price, share repurchases can be a good use of profits and have tax advantages over dividends. Therefore, share repurchases are totally company-dependent, and dependent on whether you maximize your portfolio for current income or total long-term risk-adjusted tax-advantaged returns.
The insurance industry is the best industry for share repurchases, in my opinion. This is for a few reasons. The main reason is that insurance companies typically have very low P/E ratios, even for top companies, and so share repurchases can have an enormous impact on EPS growth because the company can buy back such a large chunk of its market capitalization each year. Travelers buys back in the ballpark of 8% of its whole market cap each year, while also paying a 2+% dividend yield. So it gives investors a double digit rate of return from dividends and share repurchases alone, without growing. Any gradual growth that occurs is on top of that rate of return.
The secondary reason for the share repurchases is that insurance companies, being generally commodified businesses, don’t necessarily benefit from growth. CEOs in any industry that pursue growth for the sake of growth are generally poor CEOs for shareholders. CEOs often have a problematic incentive to grow the company regardless of whether it benefits profitability, because CEO compensation is generally based on company size more than company profitability and performance. A CEO of a large company with mediocre performance is usually much better paid than an outstanding CEO of a market-beating small or medium company. A good CEO pursues long-term profitability regardless of company size. Sometimes this means focusing on growth to drive up scale and dig a moat for the long-term. Sometimes this means returning cash to shareholders in the form of dividends or share repurchases. Sometimes this even means divesting non-core parts of the business to streamline and focus on key strengths and higher margins. Insurance companies above a certain size no longer benefit from growth. They already have any benefits they’ll get from scale and won’t get more benefits from more scale. So, they should focus on profitability. And so, the top-performing insurance companies often buy back a lot of their own stock, since it offers good returns for shareholders that continue to hold onto their shares.
A great thing about this is that all else being equal, EPS and book value per share growth increase more quickly when the P/E is lower. The lower the share price, the more shares the company can buy with the same amount of money, and since most of the per-share growth is from these buybacks, the growth rate is heavily dependent on current stock P/E.
For example, a hypothetical insurance company that uses 100% of its earnings to buy back shares, and currently has a P/E of 10, can buy back 10% of its market cap per year and therefore can grow earnings and book value and dividends per share at a rate of 10% per year in addition to any mild growth they may have from increasing revenue. An identical company with a P/E of 15 can only buy back about 6.7% of its market cap each year, and therefore can only grow earnings and book value and dividends per share at a 6.7% yearly rate in addition to revenue growth. So, for insurance companies that buy back huge amounts of stock, the earnings multiple really matters, and you want it to be as low as possible, all else being equal. Travelers is a top notch insurer with a P/E in the range of about 10, pays 20-25% of its earnings as dividends, grows the revenue as a whole at a small rate about in line with inflation, buys back like 8% of its market cap per year, and so expected earnings, book value, and dividend growth per share can be expected to be around 10% per year with a 2% dividend yield.
When considering portfolio diversification, many people just consider the number of holdings and making sure they have adequate industry diversification. A sometimes overlooked factor is checking to make sure that your companies provide good returns in completely different ways and don’t all move in unison with market conditions. For example, most companies do better when economies are strong, but it’s also a good idea to own some stocks that do better when the economy is poor. Or, a company like Compass Minerals (NYSE: CMP) that sells road salt has much of its performance determined by snowy weather, not by the state of the economy. Travelers and other good quality property casualty companies offer good rates of return without even really growing. Profitability is mainly determined by underwriting quality and interest rates, with only mild reliance on economic strength of the regions they operate in. So, I always like to own at least one good quality insurer in my portfolio that gives low double digit returns entirely through dividends and share repurchases.
In conclusion, Travelers is one of the leading property casualty insurers, with a history of outperformance, trading at a low valuation, delivers most of its returns without even need to grow, and has the potential for mild tailwinds from rising interest rates going forward. It looks strong at the current price of under $115.
Brookfield Asset Management Inc. (NYSE: BAM)
I continue to view the Brookfield collection of stocks very favorably for long term outperformance potential. This includes Brookfield Asset Management (BAM), Brookfield Property Partners (BPY), Brookfield Infrastructure Partners (BIP), and Brookfield Renewable Energy (BEP). My preference is for BAM and BIP, personally.
Although the line of business is fairly straightforward, Brookfield Asset Management is one of the most complex publicly traded structures on the market. And it’s difficult to determine a fair value for due to the number of layers. But for all that, I believe the company has a high likelihood of substantially outperforming the market over the long run as it has already outperformed the market in the past due to unusually good management and a unique set of competitive advantages and growth opportunities.
BAM was originally known by different names and was in the hydroelectric power business, but transformed substantially over time. A young Bruce Flatt joined the company in 1990 in his 20’s and became CEO in 2000, when he was in his 30’s. A few years later, the company changed its name to Brookfield Asset Management and started dramatically expanding and changing its line of business, including partially spinning of multiple new publicly traded partnerships like BPY, BIP, and BEP. Flatt, now in his 50’s, continues to head BAM, and the company has significantly outperformed the market during his tenure. Flatt and other top executives own 20% of BAM, so their incentive is strongly aligned with shareholders.
BAM’s primary focus is to provide alternative investment opportunities to institutional investors, mostly in the areas of real estate, infrastructure, renewable energy, and private equity, collectively referred to as “real assets”, and they’re one of the largest and most established companies at what they do. So for example, when an insurance company or pension fund or sovereign wealth fund or a very high net worth individual wants to put perhaps 5-15% of its portfolio into alternative investments for increased diversification (other than stocks/bonds/treasuries/etc), they can go to BAM to invest in one of their private funds. BAM also invests its own capital in its own funds to inspire trust from its clients, so they make money both from fees they charge their clients for managing these investments, and from the performance of the investments themselves. Typical fees are 1-2% of the assets managed, depending on the complexity of the specific assets.
To get access to more capital, including permanent capital, BAM has spun off most of its holdings into several publicly traded partnerships, with the largest being Brookfield Propety Partners (BPY), the next largest being Brookfield Infrastructure Partners (BIP), and the third largest being Brookfield Renewable Energy (BEP). BAM holds the General Partners of these partnerships and a significant chunk of the limited partner units. Individual investors hold the rest of the limited partner units. BAM is entitled to an increasing percentage of profits from these partnerships, and also charges a management fee for running those partnerships.
So, investors have multiple ways to invest in these assets. If you want to have exposure to their property portfolio (including prime office real estate in New York and London and other top real estate), along with a 4.5-5% distribution yield and decent distribution growth, you can invest in units of BPY. If you want exposure to their global infrastructure portfolio (including shipping ports, coal terminals, toll roads, natural gas pipelines, and telecommunications infrastructure spread across numerous continents) and a high 5% distribution yield along with fairly high distribution growth, you can invest in BIP. If you want exposure to renewable energy (mostly hydroelectric power along with some wind farms), a 6% distribution yield, and decent distribution growth, you can invest in BEP. If you want exposure to all of it along with private equity as well, and are willing to accept a low 1-2% dividend yield but likely higher overall returns from growth, you can invest directly in BAM. If you’re extremely wealthy or you manage an institutional fund, you can invest in one of BAM’s private funds. All of them have different risk and reward opportunities.
All of the public partnerships are tax-advantaged but you’ll have to fill out a K1 form during tax season. In contrast, BAM itself is a corporation based in Canada, and its stock is like any other common stock with normal tax consequences of dividends and capital gains.
The assets within BAM and all of their partnerships all have very deep, very wide economic moats. Hydroelectric dams, toll roads, shipping ports, coal terminals, railways, telecommunications structures, and property in financial districts of New York and London, all have geographic moats because they’re either geographically limited or regulated, and they typically produce strong cash flows. They’re diversified globally into North America, South America, Europe, and Australia, and a bit into Asia. BAM as an asset manager has a moat in the form of scale, because they’re a leading provider of private infrastructure and property funds, and capital that investors provide is illiquid and committed for long periods of time, essentially meaning switching costs are high. The risk for BAM and all these assets doesn’t really come from competitors; it comes from the performance of the global economy and from how well the assets are managed. Shipping ports do poorly during recessions, dams do poorly when rainfall is low, and too much leverage can increase risk, for example. BAM’s performance also depends on to what extent institutional investors will continue to want to invest in real estate and infrastructure.
But since Flatt and other BAM executives stick to value-investing contrarian methods, they can also benefit from global weakness even as their own operations are negatively affected. During the 2008-2009 recession and onwards, they bought up high quality assets around the world, mostly assets owned by financially stressed organizations. They used their large scale and high liquidity to take advantage of financially troubled assets and companies, to buy them at cheap prices and stabilize them for growth, and this continues to be their strategy going forward. They also can build platforms out of their assets and expand internally, like buying railways and coal terminals in Australia that work together and then expanding that platform with organic expansion. Plus, when they buy assets in troubled places, the currency of those places is often low as well, so they often have currency advantages when they invest.
Investing in BAM stock:
The main things that drive BAM’s growth are: a) performance of its investments in all these asset classes and b) its overall amount of fee bearing capital. In other words, the more it can grow the amount of assets they manage via public partnerships or private funds, the more money they can make from fees on those assets. And the better their private funds and partnerships perform, since they’re directly invested in them along with clients and limited partners, the better BAM’s financial results will be.
BAM currently manages $225 billion in capital, and about $95 billion of that is fee-bearing capital. Fee-bearing capital has doubled over the last four years, from $47 billion to $95 billion, and at a smooth rate. 40% of the fee-bearing capital is in the form of private funds, 39% of it is in the form of the publicly listed partnerships, 14% is public markets, and 7% are transactions and advisory.
Unlike US Bancorp and Travelers, BAM is mildly negatively affected by rising interest rates. This is because most of their assets are real estate and heavy long-lived infrastructure, which means using considerable debt. So when interest rates go up, they have to pay more money to get the capital to buy their assets. However, there’s little reason to believe that interest rates will go very high, and it makes sense to have stock holdings that benefit from both low interest and high interest rate environments, so that you can remain largely indifferent to interest rates.
BAM, however, benefits from low interest rates and high equity valuations indirectly, which counterbalances the fact that their assets do better in low interest rate environments. The problems I described in the beginning of this article, like how equities are highly valued and how a long-term trend of low interest rates has made returns from fixed income securities barely keep up with inflation, are part of what helps BAM attract clients. Pension funds, insurance funds, sovereign wealth funds, and other institutional funds all want to conservatively earn decent returns. But with bond rates so low, and stocks often considered too volatile for these types of fund to hold much of, they have been turning a lot more towards alternative investments for a fraction of their portfolio. Alternative investments in the 1980’s were close to zero but now institutional funds typically hold around 10% of their portfolio in alternative investments. Private infrastructure and real estate funds can provide these institutional investors with access to stable, cash-generating assets with less volatility than publicly traded equities and are a very strong hedge against inflation. The downside is that liquidity is lower, since they have to commit long-term capital to these private funds, but since it’s only a fraction of a portfolio, that’s a fair trade from many managers’ points of view. If 5-15% of a portfolio is illiquid, it’s not a big deal, especially if they can get better returns from that part of the portfolio and can get protection from inflation.
BAM stock trades for about 15x FFO, which is the most useful profitability metric of the company. Under Flatt’s management, the stock has doubled the S&P 500 returns, and management currently expects to compound their invested capital at 12-15% per year going forward. The current price of under $35 appears very reasonable.
Investing in BIP units:
For investors that want a higher yield and a simpler structure, I think BIP is the most interesting of the publicly traded partnerships that BAM offers. It’s a good way to own a global portfolio of infrastructure that generates fairly stable and growing cash flows, and since it’s a partnership, it’s tax-advantaged.
The distribution yield is about 5.3%, and the distribution has smoothly grown at a 12% per year compounded rate since 2009. Management’s target is to grow distributions by 5-9% per year, and so far they’ve been at the high end or exceeded the target. The partnership often buys high quality infrastructure assets from financially troubled businesses and then either holds those assets or eventually sells them for much more than they paid.
The credit rating is BBB+, which is decent for an asset-heavy type of business, and BIP has plenty of liquidity, and can get more liquidity by issuing more units or by issuing bonds, and is supported by BAM. It’s definitely a good idea to keep an eye on their leverage and credit ratings over time, but so far all is good, and the history of the management is superb.
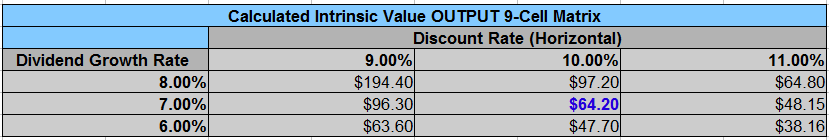
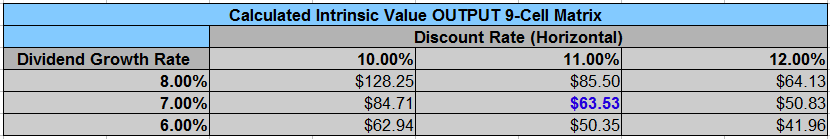
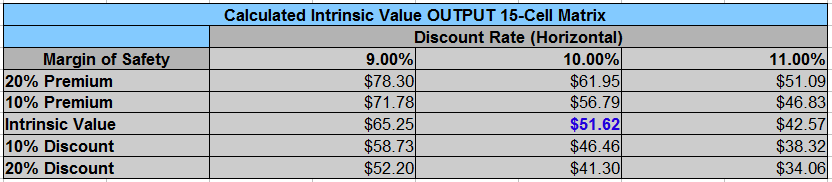
Because the distribution yield is high, BIP is an ideal candidate for using the Dividend Discount Model to determine a fair value for.
Using the past 12 months of distributions ($2.12), along with a conservative estimate of 6% distribution growth going forward (towards the bottom of their 5-9% expected distribution growth rate), and a target rate of return of 10% (higher than S&P 500 historical returns), the calculated fair value is $56.18.
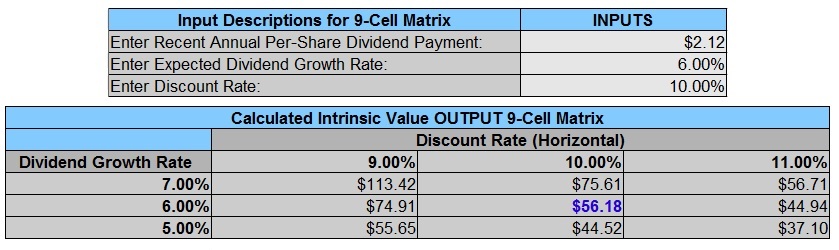
Source: Dividend Monk Toolkit Excel Calculation Spreadsheet
The current price is under $40, well below this calculated fair value of $56.18, and even below the $44.52 calculated fair value if their future distribution growth is only 5%. If distribution growth ends up being at the higher end of their expected range, returns should be quite high.
Current uncertainty around their bid to acquire Asciano (assets in Australia, potentially threatened by regulators and now a rival bid) is currently weighing down their price a bit, I believe, which gives a good opening for long-term investors.
Other High Yield Partnerships like BIP
If you’re looking for other strong high-yielding partnerships, particularly ones that lack significant commodity price exposure, then I also suggest taking a look at Magellan Midstream Partners LP (NYSE: MMP) and Spectra Energy Partners LP (NYSE: SEP). They offer yields of about 5% and 6.5% respectfully, with strong dividend growth. Both of them have negligible commodity price exposure, and yet both of their stocks have fallen from their highs along with the energy crisis sell-off. Magellan is mostly involved in the transport of refined oil, and Spectra is mostly involved with the transportation of natural gas to customers, so they have some distance from the gathering side of the energy business. I have bullish long-term views on both of them, as both are in a position to fairly conservatively provide double digit total returns for the foreseeable future with fairly high yields and growth. Magellan in particular is strong because it doesn’t have to pay incentive distribution rights to anyone and they have among the strongest balance sheets in the industry. They’ve been able to shrug off this energy price drop as though it didn’t happen.
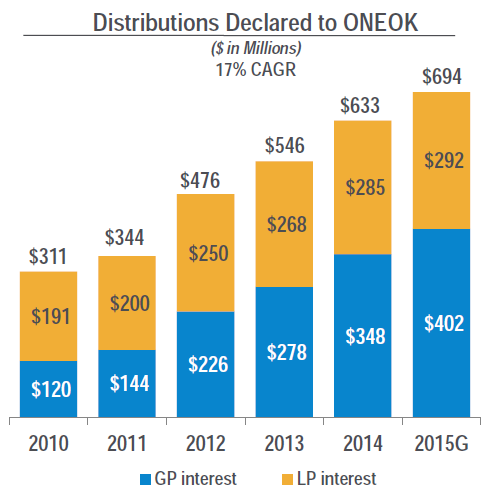
I’ve recently revised my investment thesis from six months ago on Kinder Morgan and Oneok. Both of these companies, especially Kinder Morgan, have offered investors high dividend yields, big dividend growth, and market outperformance for a very long time. But oil and gas have hit their lowest prices in a decade, both with their prices cut in half from 2014 levels. In recent months, it has become clear that these two companies were unprepared for such a large drop, and so they’ve significantly underperformed their targets. Both have become highly leveraged, and dividend cuts appear likely.
For Kinder Morgan in particular, they’ve not been managing the downturn in a way that investors are happy with. They partnered with Brookfield to buy out another company, but that company has a lot of debt. This is fine for Brookfield, as they are in a strong financial position and can make deep value investments like this, but Kinder Morgan is in a crisis with an over-leveraged balance sheet and very high debt interest. Richard Kinder appears to be going “all in” during this downturn, which may prove to be the right move years from now, but at the current time, there’s a ton of risk here. I no longer consider Kinder Morgan or Oneok to be dividend growth investments. They’re now in either “deep value” or “value trap” territory depending on what their outcomes are, rather than companies that are in a position to reliably produce growing dividend/distribution income with conservative risk.
So, if you’re an investor that allocates a part of your portfolio to publicly traded partnerships, like I do, then some of the companies with lower commodity risk and strong balance sheets are the preferable choice now compared to these higher risk, deeper value picks, assuming you’re a dividend growth investor rather than a deep value investor or speculator.
This was a situation that emphasizes the importance of diversification; anyone that had too much exposure in the industry or in certain companies in particular, likely was hit hard by this. I personally sold my KMI position at a loss at around $30/share because it was no longer in line with my investment thesis, but the overall impact to my portfolio was minimal because of proper diversification.
The Case for Selling Put Options in Today’s Market
In addition to investing in the previously mentioned reasonably priced stocks (USB, TRV, BAM, BIP, MMP, SEP), the current market with high valuations is great for selling long term cash secured put options that expire in 6-14 months.
Selling put options allow long-term investors to buy stock at a lower cost basis than the prices that shares are currently trading for. It’s like getting paid to place a long-term limit order, and is a slightly more conservative strategy than buying shares at current market prices. This has been a part of my investment strategy in 2015 due to the aforementioned problems about overvalued stock valuations in many industries.
For those that are unfamiliar with them, I’ll give a brief overview of put options.
When an investor sells one or more put options (which I’m advocating), it means they sell the potential obligation to buy a certain number of shares at a certain strike price in the future, and are neutral or bullish on the stock. The reason to do so is either to make money from the premium, or to buy the stock at a lower cost basis than what is currently available when the purchase price and premium are considered together. When an investor buys a put option (which I’m not advocating), they buy the right to sell a certain number of shares at a certain strike price in the future, and are generally neutral or bearish on the stock. The reason to do so is to have some insurance for investors that are averse to volatility or risk, or to short a stock because they expect it to decline in value.
For the put option seller, you can make money in a flat or mildly downward market, and you can potentially buy stock at a lower cost basis in the future. It mildly shifts the risk/reward profile downward, because you typically commit to a lower cost basis than what shares are currently trading for. It’s a good strategy in highly valued markets. It allows you to take advantage of volatile markets, and do fundamental analysis on a company, determine a fair value, and then commit money to that fair value even if the current price is higher than that.
If you normally keep a part of your portfolio in cash or bonds as dry powder to use during market drops, or if you’re having trouble finding good stocks at good prices today, then using put options can be a good strategy for part of your portfolio.
Selling these put options keeps risks lower than buying the stock right now, but overall risk depends on what stocks you’re doing it for. It’s generally not a good idea to do this for extremely defensive companies like KO or ADP, because volatility is so low and premiums are therefore low. It’s better to do it for solid companies in industries that are cyclical (industrial, energy, etc) or even just standard medium-volatility companies like medium/large banks or blue chip tech companies. Premiums for the most cyclical can be very high (annualized returns of 10-20% per year for slightly out-of-the-money long term puts), premiums for medium cyclical companies can be moderately high (annualized returns of 5-10% per year for slightly out-of-the-money long term puts), and premiums for extremely defensive companies will generally give less than 5%.
Here’s a moderate example:
USB 1/20/2017 $42 Put
If you feel that US Bancorp is a good investment, but want to commit to a lower cost basis to get a higher margin of safety, then selling a put option for a strike price of $42 that expires on January 20th, 2017 can do just that. To make it cash-secured means you have to put $42/share aside for if that option is excised. Each option contract is for 100 shares, so the amount of money you need to put aside is in multiples of $4,200.
The current price of USB stock is about $44 per share. If you write this put option, you’ll be paid a premium of $3.15 per share now, and then on or before 1/20/2017, the holder of the put option can obligate you to buy shares at a price of $42/share, which is lower than the current price. She would only do this if the market share price at that time is under $42. Otherwise she’ll simply let the option expire.
What this means for you, the seller, is that one of two outcomes will occur within the next 13 months until expiration.
The first potential outcome is that USB’s stock will be above $42 at the time of option expiration, which means the option will expire without you buying the stock. You’ll have gotten paid $3.15 per share, which you get to keep. The rate of return on your secured cash is about 8% over a 13 month period, or slightly less than that when calculated on an annualized basis. This means your investment can grow in value regardless of whether the stock price goes up, remains flat, or even goes mildly downward.
The other potential outcome is that USB’s stock will be below $42 at the time of option expiration. You still get to keep the $3.15 per share. But you’ll have to buy the shares at $42, regardless of what price they are at that time. For example, they’re $40/share at that time, you still have to pay $42. Your cost basis would be $38.85, which is the strike price of $42 that you’d be buying at minus the $3.15 premium you received per share. So, you’d be buying the shares at a significant discount to today’s stock price.
As a long-term investor, the key is to plan for and be satisfied with both potential outcomes. Your ultimate goal in this investment strategy would be to get a good rate of return on your cash if stocks remain flat or go up, or to buy the shares of a great company at a low cost basis if the stock price goes down.
Your overall risk profile is similar to simply buying the stock today, except a bit more conservative because you’re committed to a lower cost basis than today’s price. Your risk and reward over the next 13 months are shifted downward a bit. Someone selling put options like this will typically underperform during periods where the market goes up a lot and will outperform during periods where the market is flat or down.
If there are some otherwise blue chip energy companies you’re interested in investing in during this commodity price downturn, but want a bigger margin of safety, then selling put options to keep your cost basis low can help achieve that goal with higher premiums.
Adding It All Up
With historically high average stock valuations that do not give much of a margin of safety for the mixed aspects of today’s global economy, investors in the broad markets might not be satisfied with their expected future returns.
But by focusing on buying well-diversified stocks at good prices, especially ones with dividend yield and growth, opportunities do exist for stock performance that should outperform the market while providing solid growing income. And by using put options for a portion of your portfolio to earn income while waiting for entry points into a lower cost basis, you can moderately adjust your risk and reward profile a bit downward compared to the market, meaning you can still potentially earn good returns in a market that doesn’t perform very well over a medium or long term.